
Is It Too Late to Consider Weatherford International After Its Massive Multi Year Share Price Surge?
- Wondering if Weatherford International at around $78.99 is still a smart buy after its huge multi year run, or if most of the upside is already priced in? This breakdown will help you size up the value story with a clear, no nonsense lens.
- The stock has cooled slightly over the last week with a roughly -1.4% move, but that sits on top of a 9.4% gain over the last month, 9.3% year to date, 12.2% over the past year, and a massive 70.1% three year and 1246.5% five year return that has completely reshaped how the market views the company.
- Those kinds of returns have come as investors have steadily upgraded their expectations for oilfield services companies and rewarded balance sheet repair, portfolio reshaping, and a tighter focus on high margin work across the industry. Alongside that, the broader energy sector has seen shifting sentiment as supply dynamics, capital discipline, and long cycle investment plans keep drawing analysts back to the space. This helps explain why a name like Weatherford has been re rated rather than written off as a past cycle story.
- Even after that run, Weatherford scores a 5 out of 6 on our valuation checks, suggesting it still looks undervalued on most of the lenses we use. Next we will dig into those different valuation approaches side by side, and then circle back at the end to talk about an even better way to make sense of what the numbers are really saying about this stock.
Approach 1: Weatherford International Discounted Cash Flow (DCF) Analysis
A Discounted Cash Flow, or DCF, model estimates what a business is worth by projecting its future cash flows and then discounting those back into today’s dollars. For Weatherford International, the model uses a 2 stage Free Cash Flow to Equity approach built on cash flow projections.
Weatherford generated trailing twelve month free cash flow of about $422.1 Million, and analysts see this growing steadily over time. By 2028, free cash flow is projected to reach roughly $837 Million, with further years extrapolated by Simply Wall St to climb above $1.5 Billion by 2035 as the business scales.
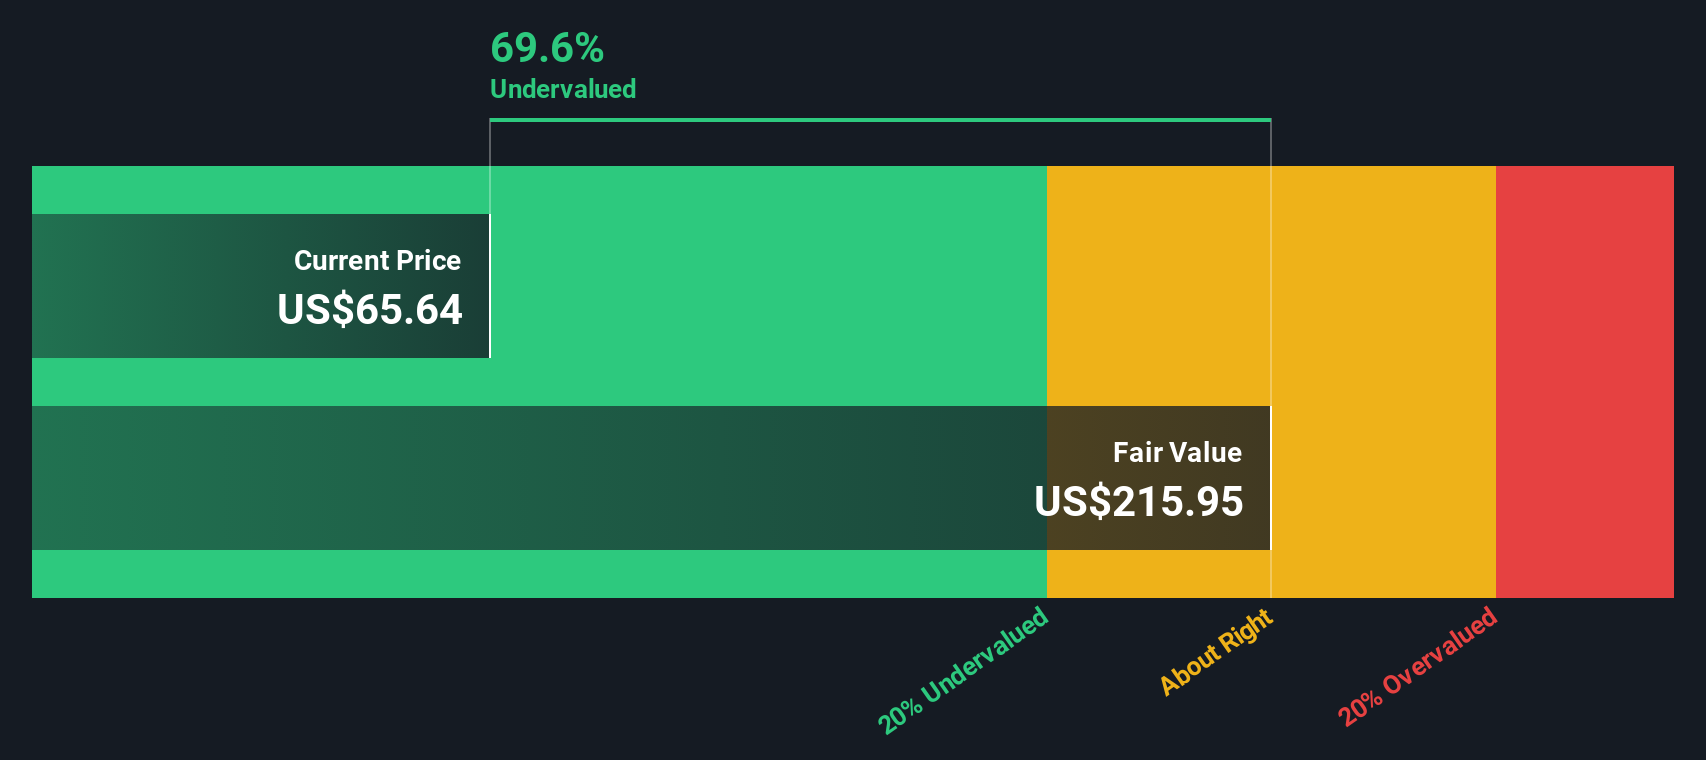
Bringing all those future cash flows back to today, the DCF model points to an estimated intrinsic value of about $346.69 per share. Compared with the recent share price around $78.99, the DCF implies the stock is trading at roughly a 77.2% discount. This indicates a wide gap between the model’s valuation and the current market price based on these assumptions.
Result: UNDERVALUED
Our Discounted Cash Flow (DCF) analysis suggests Weatherford International is undervalued by 77.2%. Track this in your watchlist or portfolio, or discover 913 more undervalued stocks based on cash flows.
Approach 2: Weatherford International Price vs Earnings
For a profitable company like Weatherford, the price to earnings (PE) ratio is a useful way to gauge how much investors are willing to pay for each dollar of current earnings. In general, faster growth and lower perceived risk justify a higher PE, while slower growth or higher risk usually pull a fair PE down.
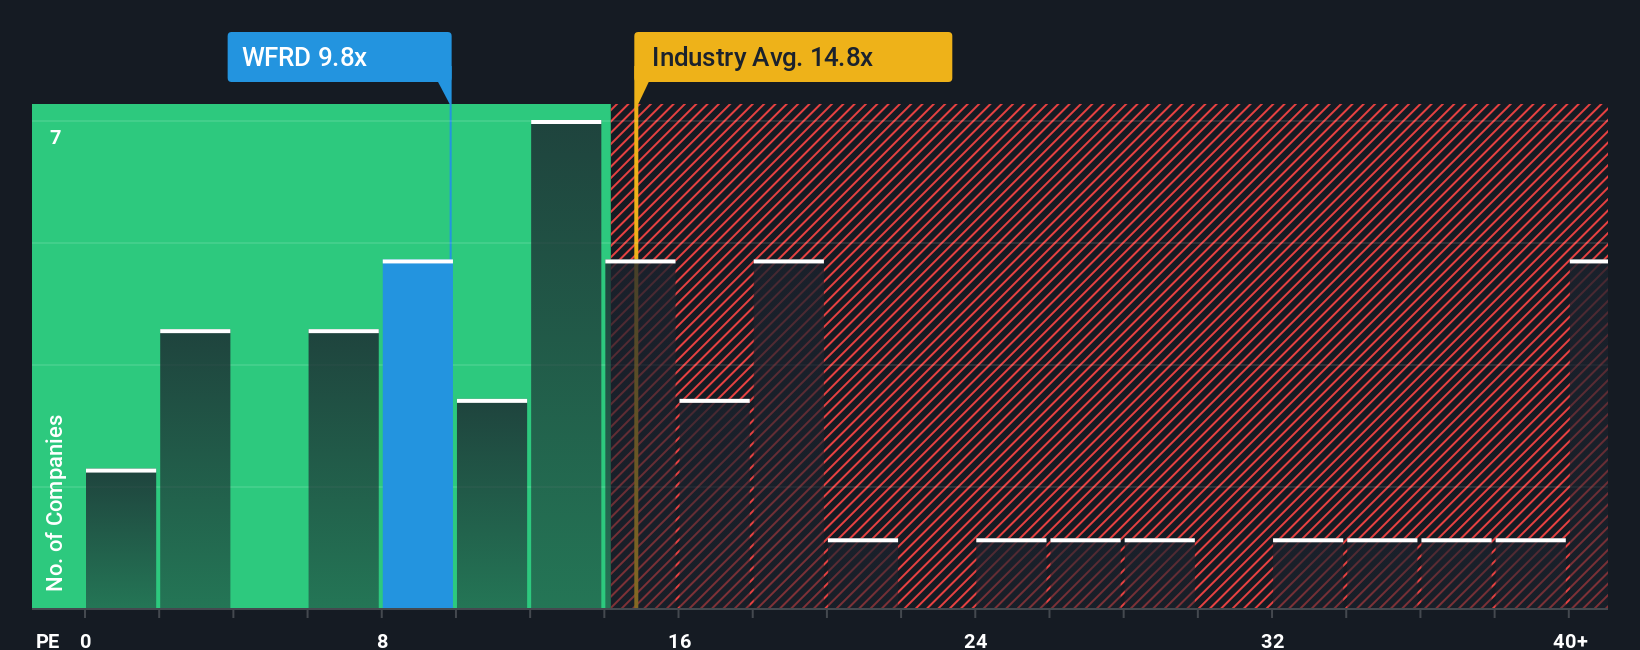
Weatherford currently trades on a PE of about 13.99x, which sits below both the Energy Services industry average of roughly 18.43x and the broader peer group average near 27.42x. Simply Wall St’s Fair Ratio for Weatherford comes in at around 15.84x, which is its proprietary estimate of what a normal PE should be once you factor in the company’s earnings growth profile, profitability, industry, market cap, and specific risks.
This Fair Ratio is more tailored than a basic peer or industry comparison because it adjusts for the things that actually drive what investors should pay, rather than assuming all companies in a sector deserve the same multiple. With the shares trading at 13.99x versus a Fair Ratio of 15.84x, the multiple suggests Weatherford still has valuation headroom.
Result: UNDERVALUED
PE ratios tell one story, but what if the real opportunity lies elsewhere? Discover 1455 companies where insiders are betting big on explosive growth.
Upgrade Your Decision Making: Choose your Weatherford International Narrative
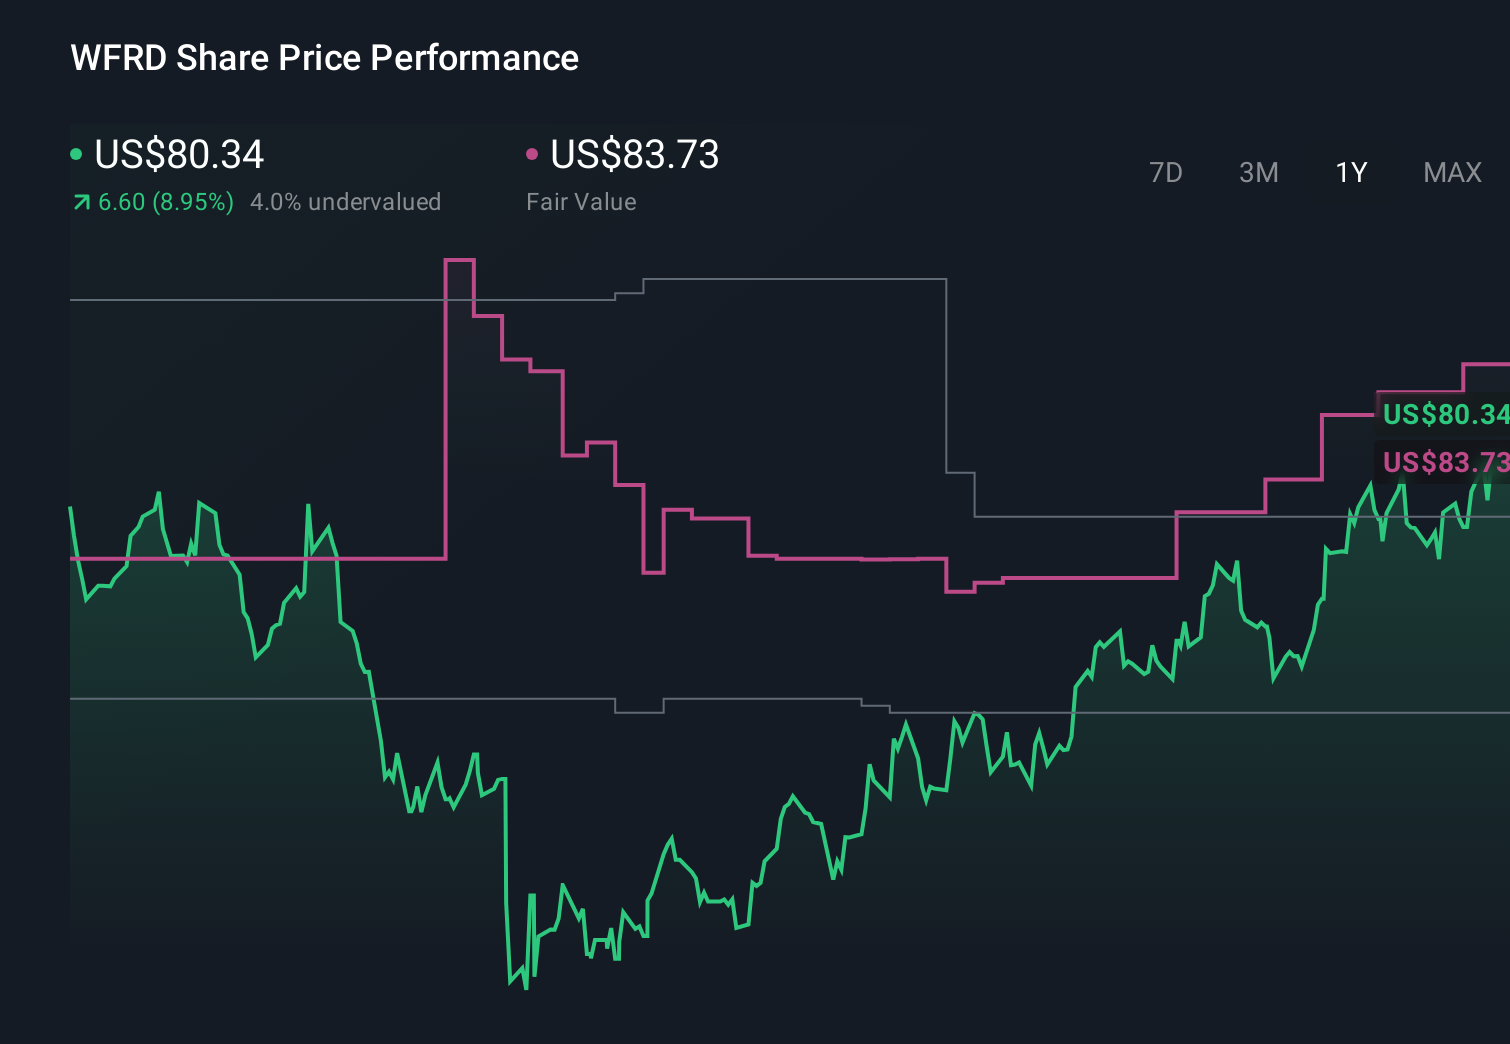
Earlier we mentioned that there is an even better way to understand valuation. Let us introduce you to Narratives, a simple tool on Simply Wall St’s Community page that lets you combine your own story about Weatherford International with a concrete financial forecast to arrive at a Fair Value you can compare to today’s price. This Fair Value then updates dynamically as new earnings, news, and guidance come in. One investor might build a bullish Weatherford Narrative that assumes margins keep strengthening, offshore demand accelerates, and justifies a Fair Value in the low to mid $80s. A more cautious investor might instead focus on prolonged international softness, pricing pressure, and macro risk to support a Fair Value closer to the high $50s. By setting out these assumptions explicitly in a Narrative, both investors can clearly see when the current market price offers enough upside to buy, or has run ahead of their Fair Value and may be a signal to trim or sell.
Do you think there's more to the story for Weatherford International? Head over to our Community to see what others are saying!
This article by Simply Wall St is general in nature. We provide commentary based on historical data and analyst forecasts only using an unbiased methodology and our articles are not intended to be financial advice. It does not constitute a recommendation to buy or sell any stock, and does not take account of your objectives, or your financial situation. We aim to bring you long-term focused analysis driven by fundamental data. Note that our analysis may not factor in the latest price-sensitive company announcements or qualitative material. Simply Wall St has no position in any stocks mentioned.
Have feedback on this article? Concerned about the content? Get in touch with us directly. Alternatively, email editorial-team@simplywallst.com