
Does Qiagen Offer Long Term Value After Recent Precision Medicine Investments?
- Wondering if Qiagen at around $45 is a hidden opportunity or a value trap? You are not alone, as this stock often divides opinion among long term investors.
- Despite a fairly flat 1 year return of about -0.2% and a modest 1.6% gain over the last month, the stock is still down over 13% across 5 years, which suggests the market is still rethinking Qiagen's long term growth profile and risk.
- Recent attention has focused on Qiagen's continued push in sample prep and molecular diagnostics, along with partnerships aimed at expanding test menus and improving workflow automation. This reinforces its position in high value life science tools. At the same time, ongoing investments in next generation sequencing and companion diagnostics have reminded investors that Qiagen is positioning itself as a critical infrastructure player in precision medicine rather than a short term pandemic beneficiary.
- On our scorecard, Qiagen clocks a valuation score of 4/6. This suggests it screens as undervalued on several key metrics but not all of them. Next, we will walk through the main valuation methods investors use, then finish with a more holistic way to judge whether that apparent discount really stacks up.
Find out why Qiagen's -0.2% return over the last year is lagging behind its peers.
Approach 1: Qiagen Discounted Cash Flow (DCF) Analysis
A Discounted Cash Flow model projects a company’s future cash flows and then discounts them back into today’s dollars, aiming to estimate what the entire business is worth right now.
For Qiagen, the latest twelve month Free Cash Flow stands at about $479.3 million. Analysts and in house estimates see this rising steadily, with projected Free Cash Flow around 2028 of roughly $594.5 million and extrapolated figures reaching about $790.6 million by 2035, all in $. Simply Wall St uses a 2 Stage Free Cash Flow to Equity model, where the early years are driven by analyst forecasts and later years by gradually slowing growth assumptions.
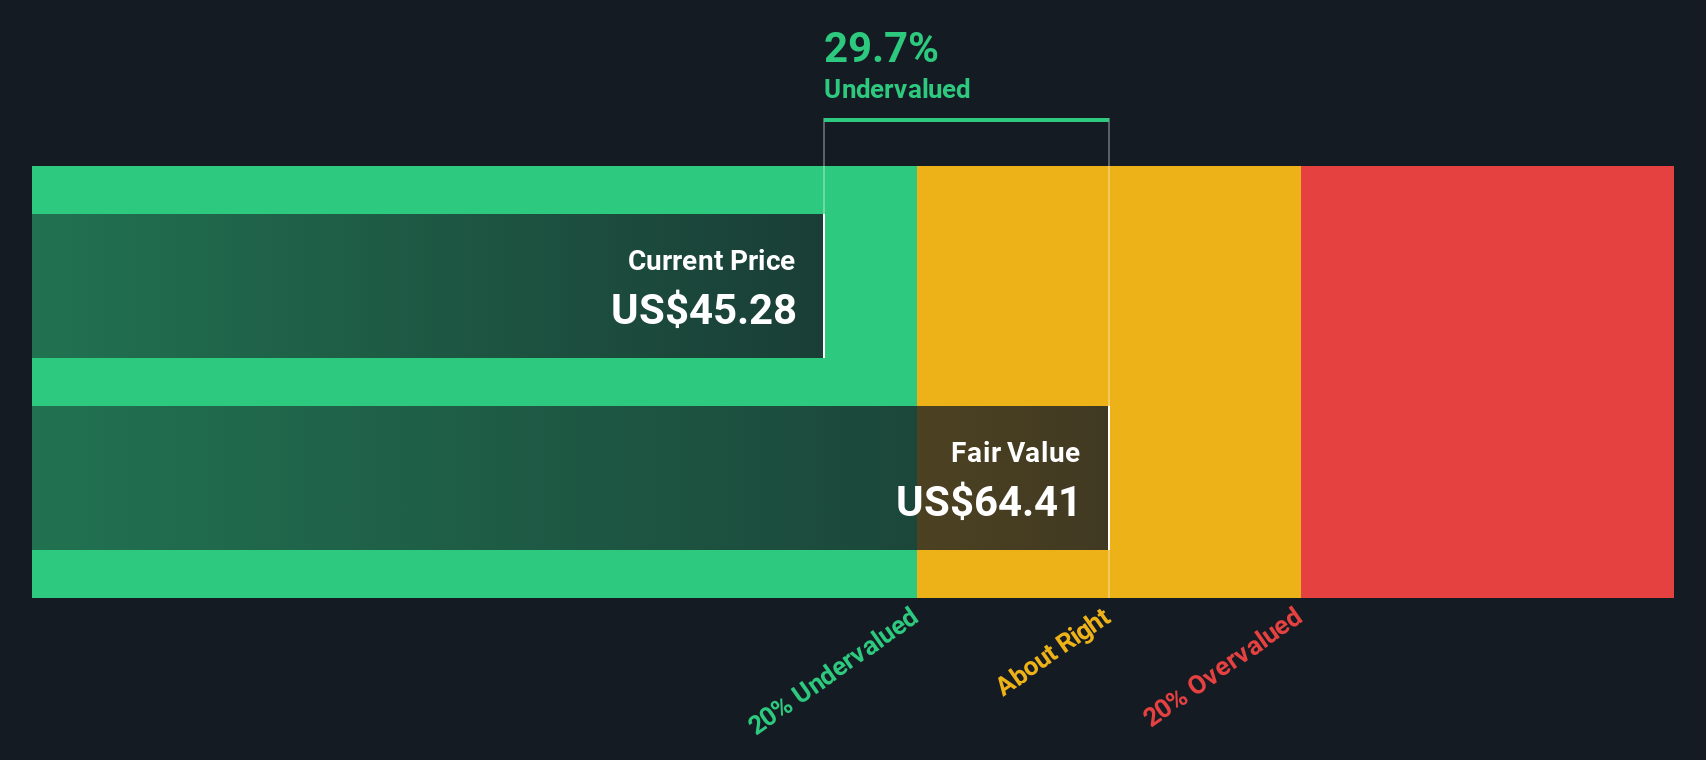
When all those future cash flows are discounted back, the model arrives at an intrinsic value of around $59.89 per share. Compared with a market price near $45, that implies Qiagen trades at roughly a 24.8% discount, suggesting investors are paying less than the DCF view of its long term cash generation potential.
Result: UNDERVALUED
Our Discounted Cash Flow (DCF) analysis suggests Qiagen is undervalued by 24.8%. Track this in your watchlist or portfolio, or discover 909 more undervalued stocks based on cash flows.
Approach 2: Qiagen Price vs Earnings
For consistently profitable companies like Qiagen, the Price to Earnings ratio is a useful shorthand for how much investors are willing to pay for each dollar of current earnings. It naturally ties valuation to today’s profitability, while still reflecting what the market expects those earnings to do in the future.
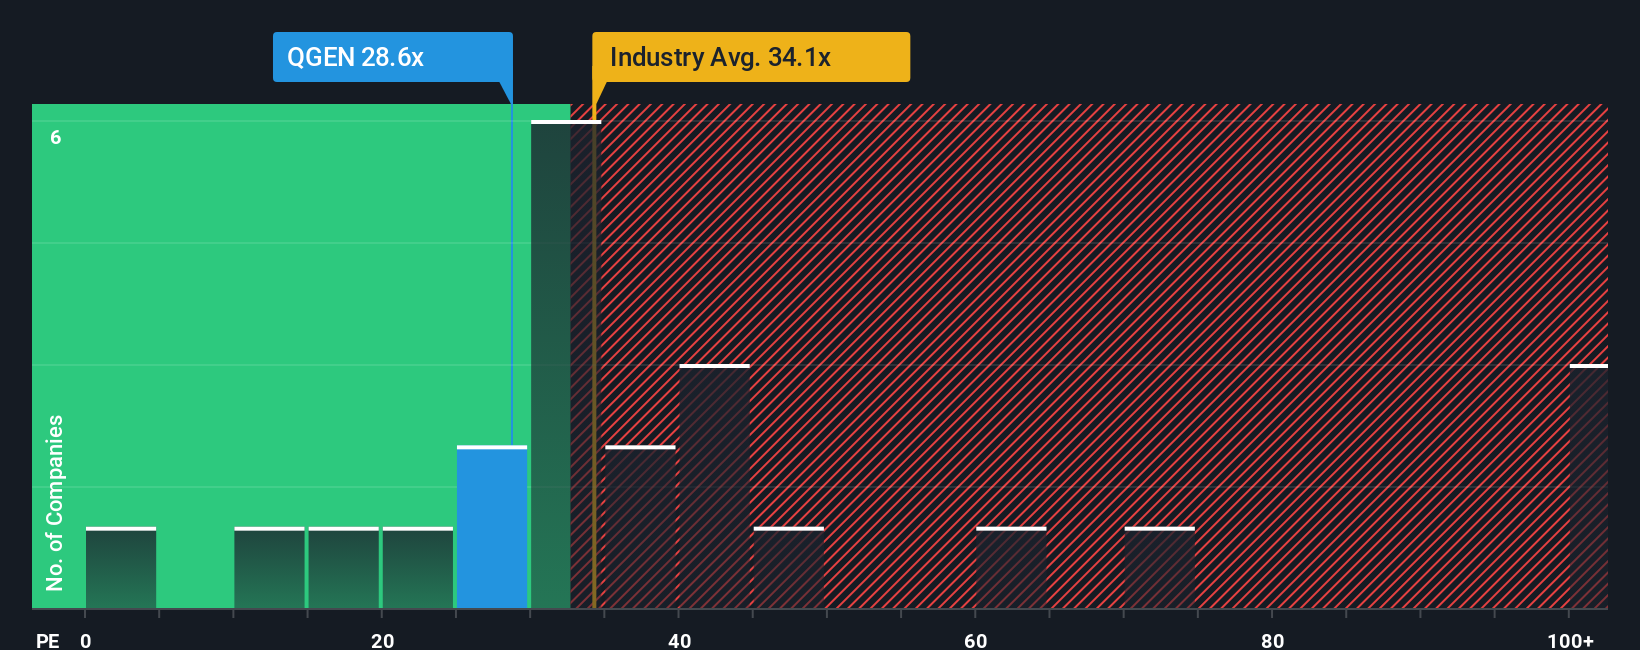
In practice, faster growth and lower perceived risk usually justify a higher PE, while slower or more volatile earnings tend to command a lower, more cautious multiple. Qiagen currently trades on about 24.1x earnings, which is below the Life Sciences industry average of roughly 35.2x and also well under the broader peer group average of around 54.9x. On those simple comparisons alone, the stock looks inexpensive.
Simply Wall St’s Fair Ratio adds more nuance by estimating what PE Qiagen ought to trade on, given its earnings growth outlook, profitability, risk profile, industry and market cap. For Qiagen, that Fair Ratio is about 20.7x, lower than the current 24.1x, which suggests the market may be paying a bit more than is justified by fundamentals once those factors are properly accounted for.
Result: OVERVALUED
PE ratios tell one story, but what if the real opportunity lies elsewhere? Discover 1456 companies where insiders are betting big on explosive growth.
Upgrade Your Decision Making: Choose your Qiagen Narrative
Earlier we mentioned that there is an even better way to understand valuation. Let us introduce you to Narratives, a simple way to connect your view of Qiagen’s business with a concrete forecast and fair value, by letting you tell a story about how its revenue, earnings and margins might evolve, then translating that story into numbers that can be compared with today’s share price.
On Simply Wall St’s Community page, used by millions of investors, Narratives make this process accessible by walking you through your assumptions, turning them into a forward financial model and a Fair Value estimate, then showing at a glance whether Qiagen looks attractive or not when you compare that Fair Value to the current price.
Because Narratives are updated dynamically as new information like earnings, guidance or news arrives, you can quickly see how your view should change. Different investors can hold very different yet transparent perspectives. For example, one Narrative might lean toward the more optimistic end of analyst targets with a fair value near $60 if you expect stronger growth and margins. Another could anchor closer to the more cautious $45 view if you think market headwinds and competition will keep a tighter lid on Qiagen’s future performance.
Do you think there's more to the story for Qiagen? Head over to our Community to see what others are saying!

This article by Simply Wall St is general in nature. We provide commentary based on historical data and analyst forecasts only using an unbiased methodology and our articles are not intended to be financial advice. It does not constitute a recommendation to buy or sell any stock, and does not take account of your objectives, or your financial situation. We aim to bring you long-term focused analysis driven by fundamental data. Note that our analysis may not factor in the latest price-sensitive company announcements or qualitative material. Simply Wall St has no position in any stocks mentioned.
Have feedback on this article? Concerned about the content? Get in touch with us directly. Alternatively, email editorial-team@simplywallst.com