
Is Novo Nordisk Attractively Priced After Its Sharp 2024 Share Price Slide?
- If you have been wondering whether Novo Nordisk is a bargain or a value trap at today’s price, you are not alone. This article is going to walk you through the key numbers that actually matter.
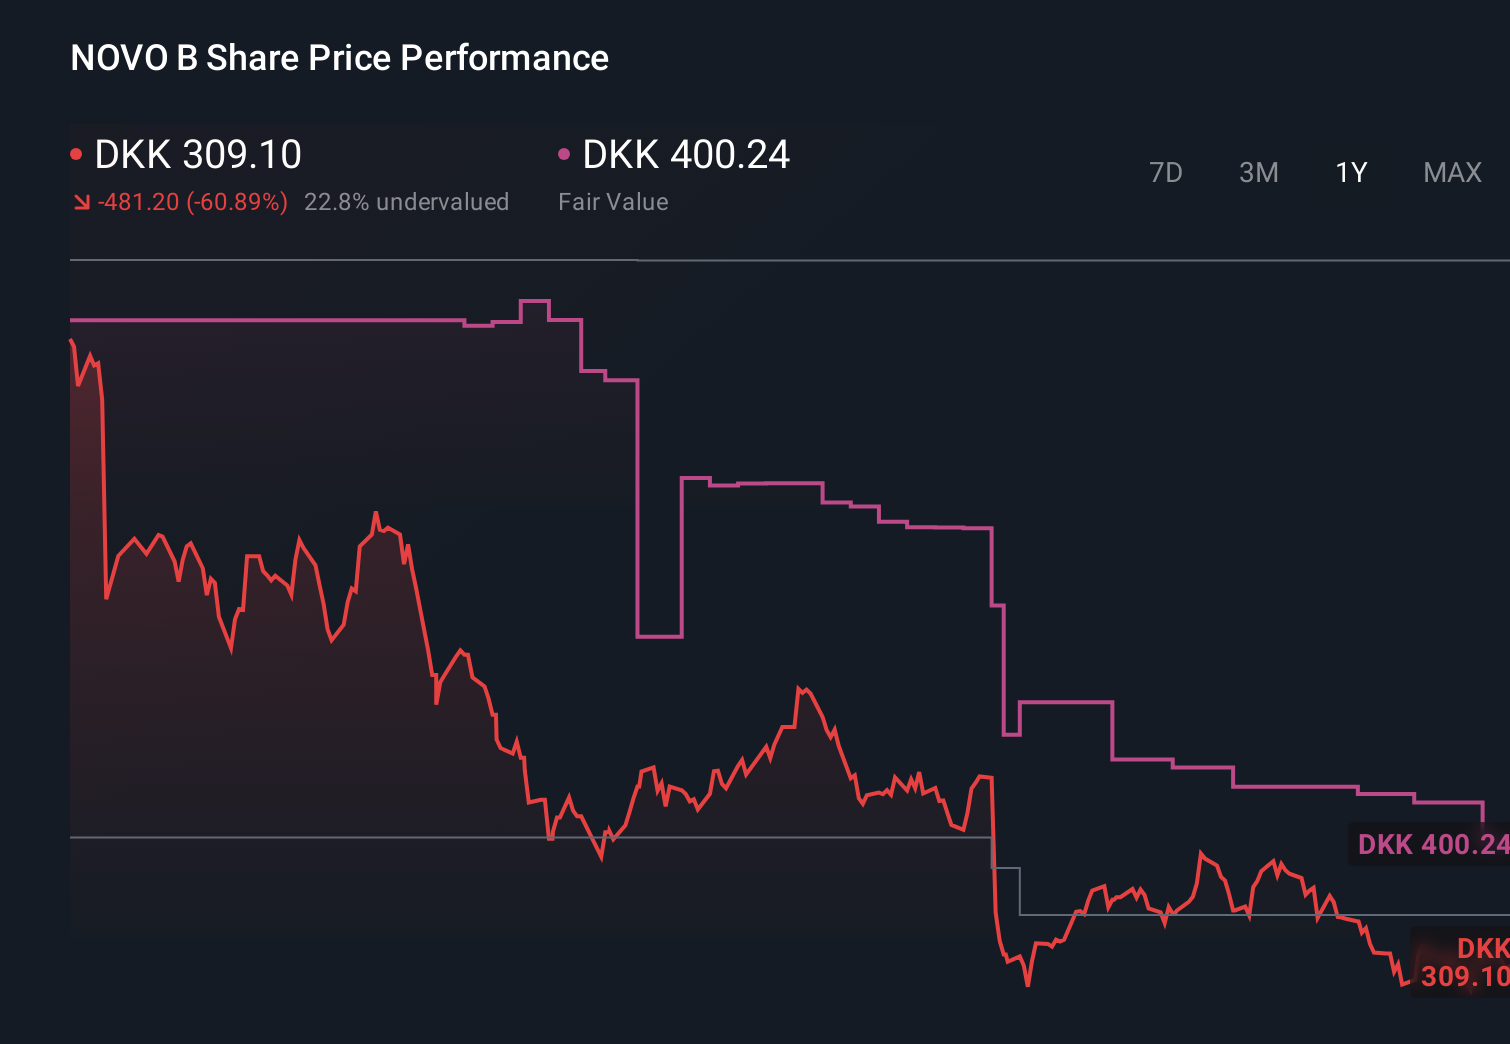
- The shares recently closed at 309.35, with a 3.4% gain over the last 7 days, a roughly flat -0.5% over 30 days, but a sharp slide of -51.6% year to date and -58.7% over the last year. This tells us the market’s view of its risk and growth potential has shifted dramatically, despite a still respectable 56.1% gain over 5 years.
- Those moves have come against a backdrop of intense focus on Novo Nordisk’s role in obesity and diabetes treatments, alongside ongoing debates about competition, pricing pressure, and long term demand for its flagship therapies. At the same time, investors are weighing regulatory developments and broader healthcare policy trends, which can quickly tilt sentiment for a company so central to these markets.
- On our checks, Novo Nordisk scores a solid 5 out of 6 for valuation, suggesting it looks undervalued on most metrics. Next, we will break down those different valuation approaches before finishing with an even more practical way to think about what the stock is really worth.
Find out why Novo Nordisk's -58.7% return over the last year is lagging behind its peers.
Approach 1: Novo Nordisk Discounted Cash Flow (DCF) Analysis
A Discounted Cash Flow model estimates what a company is worth by projecting the cash it can generate in the future and then discounting those cash flows back into today’s DKK.
Novo Nordisk currently generates about DKK 67.6 billion in free cash flow, and analysts expect this to rise steadily as demand for its obesity and diabetes treatments grows. Based on analyst estimates for the next few years and then extrapolations by Simply Wall St, free cash flow is projected to reach roughly DKK 199.0 billion by 2035. These projections are fed into a 2 Stage Free Cash Flow to Equity model, which captures a faster growth phase followed by more moderate expansion.
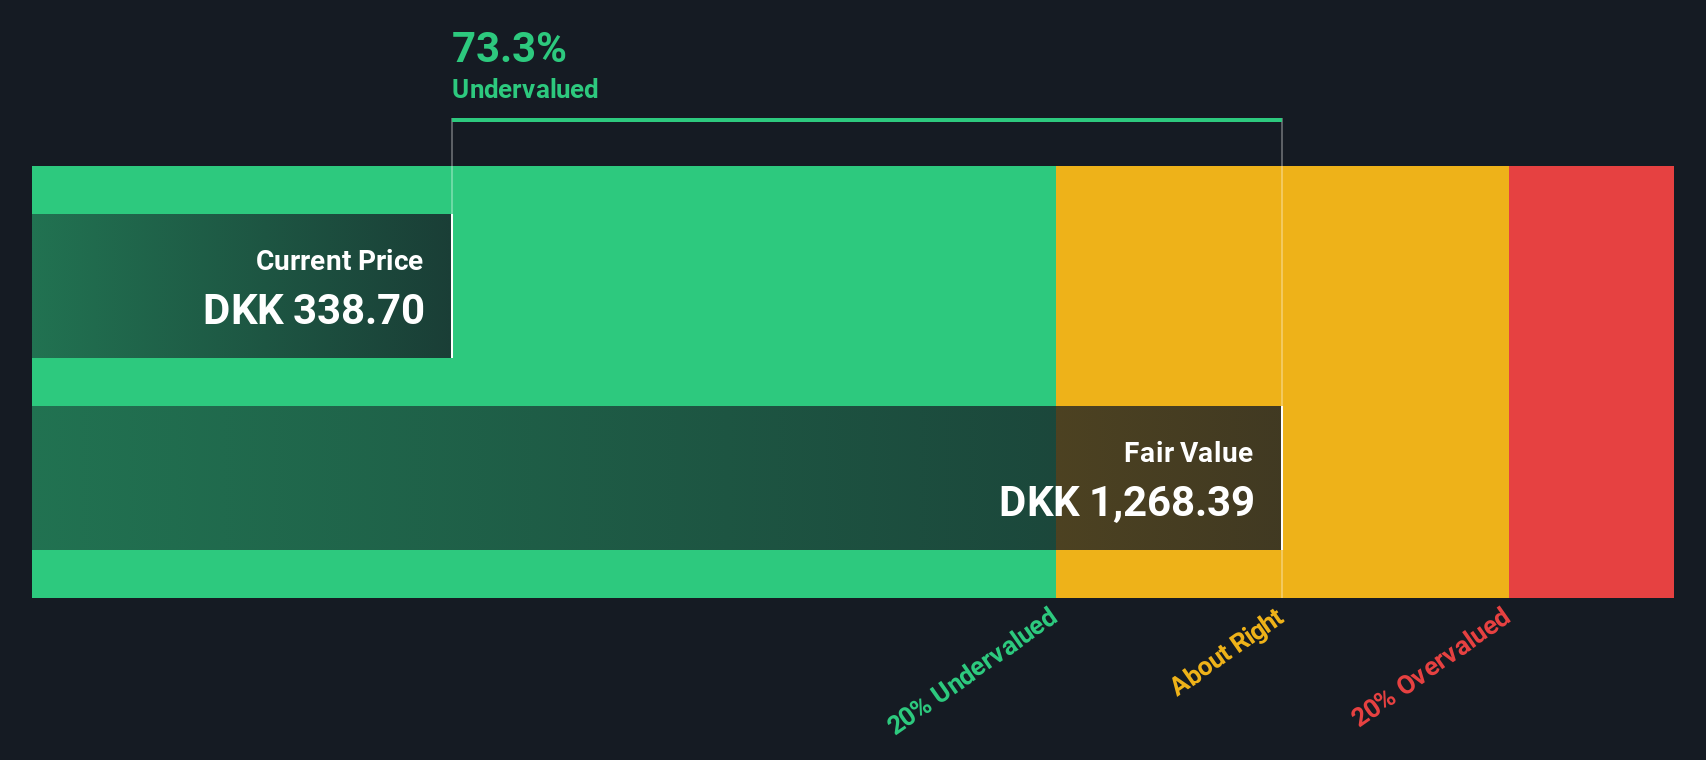
When those future billions of DKK in cash flows are discounted back to today, the model arrives at an intrinsic value of about DKK 1,060.61 per share. Compared with the recent market price of around DKK 309, the DCF suggests the stock is roughly 70.8% undervalued.
Result: UNDERVALUED
Our Discounted Cash Flow (DCF) analysis suggests Novo Nordisk is undervalued by 70.8%. Track this in your watchlist or portfolio, or discover 911 more undervalued stocks based on cash flows.
Approach 2: Novo Nordisk Price vs Earnings
For a consistently profitable business like Novo Nordisk, the price to earnings ratio is a straightforward way to gauge whether investors are paying a reasonable price for each unit of current earnings. In general, faster growth and lower perceived risk justify a higher PE multiple, while slower growth or greater uncertainty should pull that multiple down.
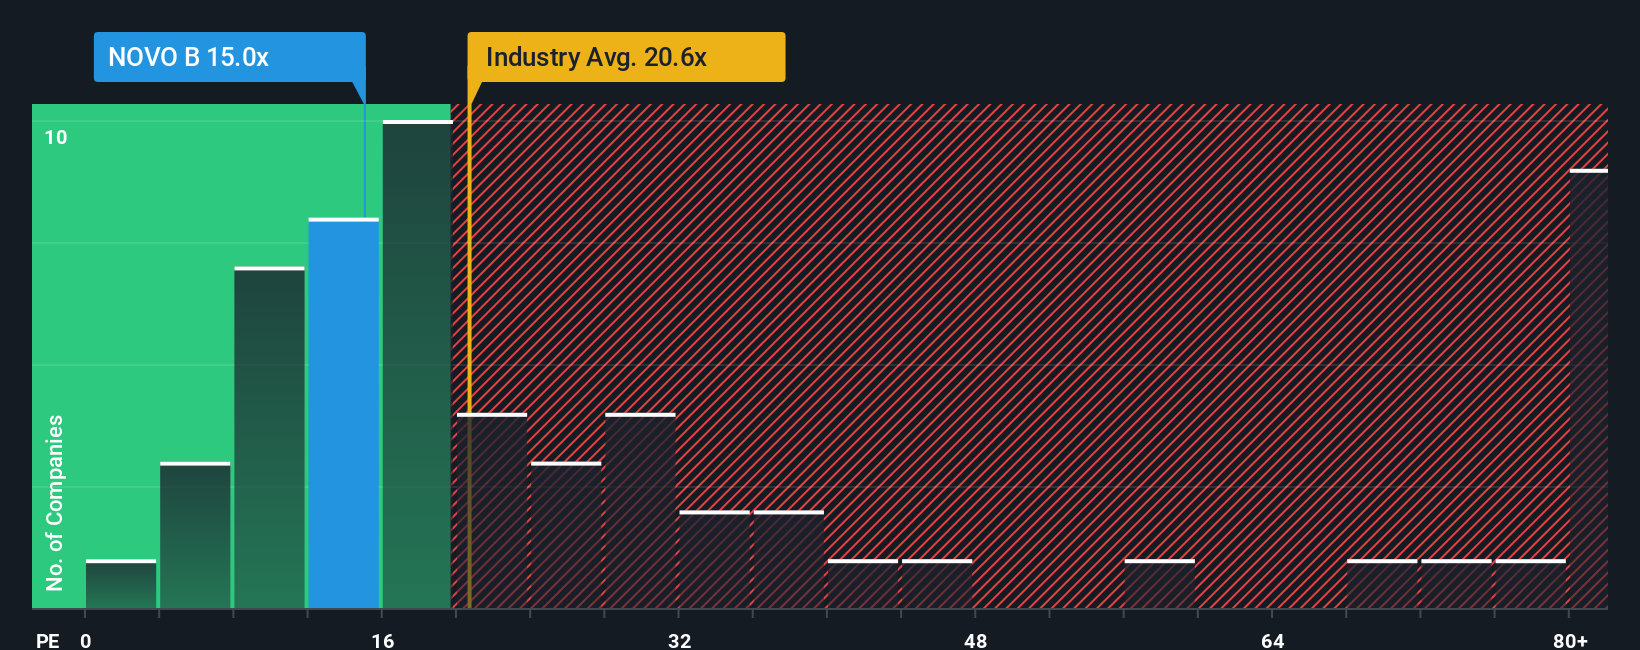
Novo Nordisk currently trades on a PE of about 13.2x, which is noticeably below both the Pharmaceuticals industry average of roughly 22.5x and the broader peer group around 25.7x. At first glance, that discount suggests the market is pricing Novo Nordisk as if it has lower growth prospects or higher risks than its competitors.
Simply Wall St’s Fair Ratio framework goes a step further by estimating what PE multiple would make sense for Novo Nordisk given its earnings growth, profit margins, industry, size, and specific risk profile. For Novo Nordisk, that Fair Ratio is about 26.2x, much closer to or even above peers, implying that, if the company delivers as expected, today’s 13.2x may be undemanding.
Result: UNDERVALUED
PE ratios tell one story, but what if the real opportunity lies elsewhere? Discover 1457 companies where insiders are betting big on explosive growth.
Upgrade Your Decision Making: Choose your Novo Nordisk Narrative
Earlier we mentioned that there is an even better way to understand valuation. Let us introduce Narratives, a simple tool on Simply Wall St’s Community page that lets you attach your own story about Novo Nordisk’s future, including your assumptions for revenue growth, earnings, margins, and fair value. It then compares that Fair Value to today’s Price so you can decide when to buy or sell. Narratives automatically update when new news or earnings are released, and they can span very different perspectives. For example, one investor might think Novo’s obesity and diabetes franchise justifies a fair value near DKK 1,036, while another might believe a more cautious outlook supports a fair value closer to DKK 393. Each Narrative links the company’s story to a forecast and then to a concrete valuation.
Do you think there's more to the story for Novo Nordisk? Head over to our Community to see what others are saying!
This article by Simply Wall St is general in nature. We provide commentary based on historical data and analyst forecasts only using an unbiased methodology and our articles are not intended to be financial advice. It does not constitute a recommendation to buy or sell any stock, and does not take account of your objectives, or your financial situation. We aim to bring you long-term focused analysis driven by fundamental data. Note that our analysis may not factor in the latest price-sensitive company announcements or qualitative material. Simply Wall St has no position in any stocks mentioned.
Have feedback on this article? Concerned about the content? Get in touch with us directly. Alternatively, email editorial-team@simplywallst.com