
Mainstreet Equity (TSX:MEQ) FFO Growth Supports Bullish Narratives Despite One‑Off‑Boosted EPS
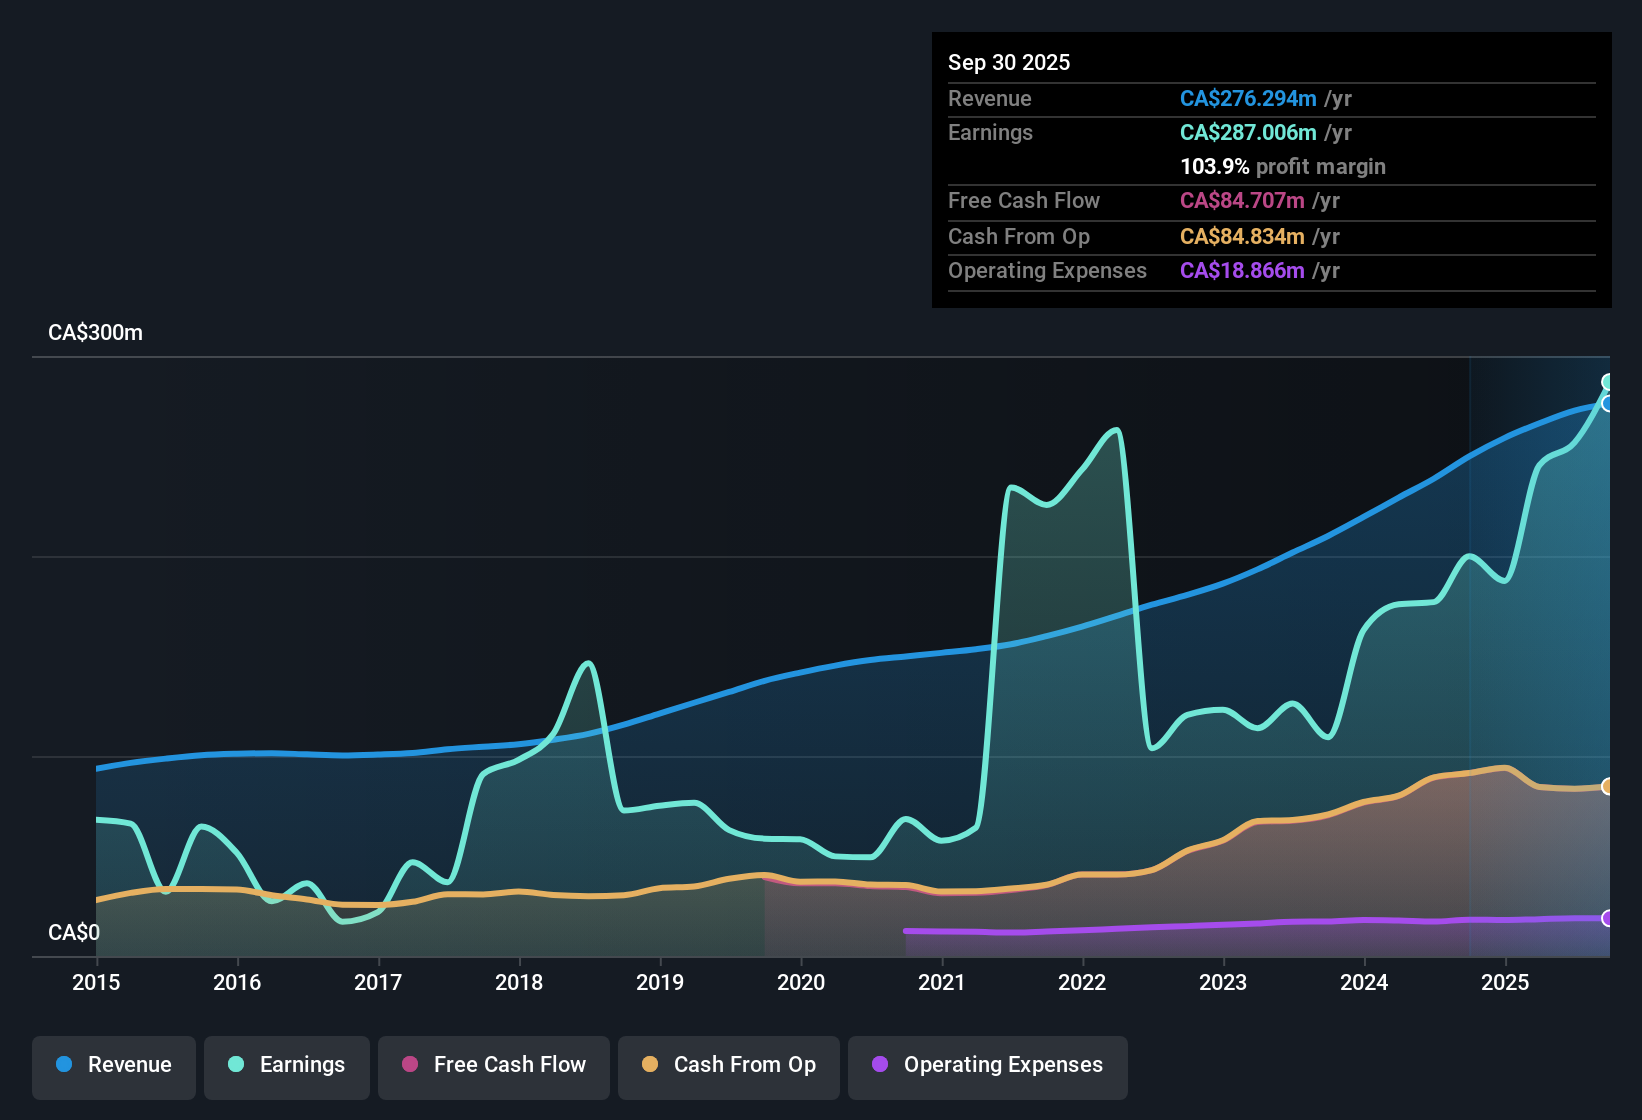
Mainstreet Equity (TSX:MEQ) has just wrapped up FY 2025 with fourth quarter revenue of CA$70.5 million and basic EPS of CA$10.0, capping a trailing twelve month performance of CA$276.3 million in revenue and CA$30.8 in EPS. Over the past year, the company has seen revenue climb from CA$249.8 million to CA$276.3 million while EPS moved from CA$21.4 to CA$30.8, alongside trailing net income increasing from CA$199.9 million to CA$287.0 million and FFO per share improving from CA$9.83 to CA$11.43. Taken together, the latest print points to substantially fatter margins that will have investors weighing how much of this uplift is sustainable versus one off driven.
See our full analysis for Mainstreet Equity.With the headline numbers on the table, the next step is to stack these results against the dominant narratives around Mainstreet Equity and see which stories hold up and which ones need a rethink.
Curious how numbers become stories that shape markets? Explore Community Narratives
FFO per share climbs to CA$11.43
- On a trailing basis, FFO per share reached CA$11.43, up from CA$9.83 a year earlier, with quarterly FFO per share in FY 2025 ranging between CA$2.36 and CA$3.22.
- What stands out for a bullish angle is that this FFO progression gives a cash flow based backdrop to the 43.6% earnings growth, even though:
- Reported net income of CA$287.0 million in the last twelve months includes a CA$235.0 million one off gain that flatters EPS.
- Trailing revenue of CA$276.3 million and FFO per share of CA$11.43 show the core rental engine contributing alongside that non recurring boost.
43.6% earnings growth with a catch
- Earnings grew 43.6% over the past year with a 5 year compound growth rate of 13.6% per year, but a CA$235.0 million one off gain is identified as a major driver of the trailing twelve month profit jump to CA$287.0 million.
- Critics highlight that the bearish worry about earnings quality is grounded in the numbers, because:
- Net profit margins are described as higher than last year at around 80%, yet that level is explicitly linked to the CA$235.0 million non recurring gain.
- Without that one off item, the 43.6% reported growth rate would be materially lower, so headline profitability overstates the ongoing earning power of the portfolio.
Low 5.9x P/E versus DCF fair value
- Mainstreet trades at a P/E of 5.9 times, well below the North American real estate industry average of 15.5 times and the Canadian market P/E of 16.2 times, while the CA$182.10 share price sits above the DCF fair value estimate of CA$165.01.
- What is interesting for value focused investors is how this combination both supports and complicates a bullish thesis, because:
- The below industry P/E alongside forecast revenue growth of about 6.02% per year points to a stock that screens as inexpensive relative to its growth outlook.
- At the same time, the DCF fair value running below the current price and the note that interest payments are not well covered by earnings highlight that balance sheet pressure and cash flow assumptions matter as much as the simple multiple.
Next Steps
Don't just look at this quarter; the real story is in the long-term trend. We've done an in-depth analysis on Mainstreet Equity's growth and its valuation to see if today's price is a bargain. Add the company to your watchlist or portfolio now so you don't miss the next big move.
See What Else Is Out There
Mainstreet Equity combines rising FFO with low earnings multiples, but heavy reliance on a large one off gain and weak interest coverage expose financial fragility.
If those balance sheet and earnings quality concerns give you pause, use our solid balance sheet and fundamentals stocks screener (1943 results) to quickly shift your focus toward companies built on sturdier financial foundations.
This article by Simply Wall St is general in nature. We provide commentary based on historical data and analyst forecasts only using an unbiased methodology and our articles are not intended to be financial advice. It does not constitute a recommendation to buy or sell any stock, and does not take account of your objectives, or your financial situation. We aim to bring you long-term focused analysis driven by fundamental data. Note that our analysis may not factor in the latest price-sensitive company announcements or qualitative material. Simply Wall St has no position in any stocks mentioned.
Have feedback on this article? Concerned about the content? Get in touch with us directly. Alternatively, email editorial-team@simplywallst.com