
Is It Too Late to Consider IBM After Its Big Hybrid Cloud and AI Driven Rally?
- If you are wondering whether International Business Machines is still a value play after its big run up, or if you would just be buying into yesterday's story, this breakdown is designed to cut through the noise for you.
- Even after a slight pullback of 2.4% over the last week and a modest 0.8% dip over the past month, IBM is still up 37.8% year to date and 35.8% over the last year, with gains of 139.4% over 3 years and 215.8% over 5 years.
- Behind these moves, IBM has been in the headlines for its continued push into hybrid cloud and AI driven software, alongside ongoing portfolio reshaping and strategic partnerships that aim to reposition the company as a higher growth, higher margin platform rather than an old line hardware giant. Together, these developments have influenced how the market views IBM's long term relevance and risk profile, which is important context for judging whether today's price still makes sense.
- On our valuation checks, IBM scores a 1 out of 6, suggesting that on traditional metrics the stock does not appear broadly undervalued. Next we will unpack how different valuation methods interpret that score and then finish with a more nuanced way to think about what IBM may be worth.
International Business Machines scores just 1/6 on our valuation checks. See what other red flags we found in the full valuation breakdown.
Approach 1: International Business Machines Discounted Cash Flow (DCF) Analysis
A Discounted Cash Flow, or DCF, model estimates what a company is worth today by projecting the cash it can generate in the future and then discounting those cash flows back into present value.
For International Business Machines, the latest twelve month Free Cash Flow is about $11.7 billion, and analysts expect this to rise steadily as the business leans further into hybrid cloud and AI software. Under Simply Wall St’s two stage Free Cash Flow to Equity model, forecast cash flows grow to roughly $23.0 billion by 2035, with analyst estimates guiding the next few years and later years extrapolated from those trends.
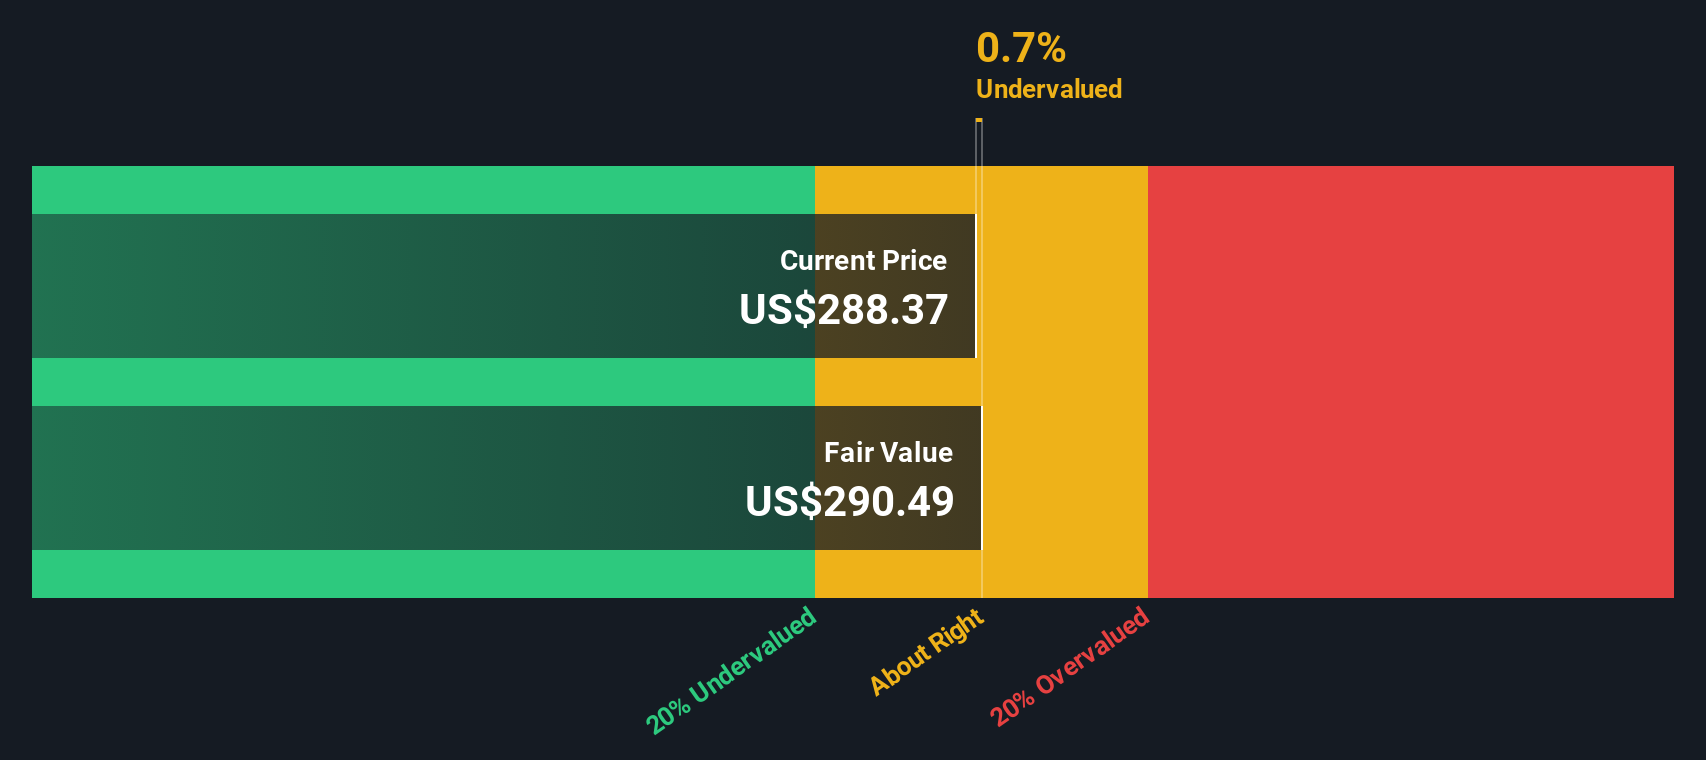
Bringing all of those projected cash flows back to today, the model arrives at an intrinsic value of roughly $282.40 per share. With the DCF implying the stock is about 7.4% above its fair value, IBM screens as slightly overvalued on this measure, but not by a wide margin.
Result: ABOUT RIGHT
International Business Machines is fairly valued according to our Discounted Cash Flow (DCF), but this can change at a moment's notice. Track the value in your watchlist or portfolio and be alerted on when to act.
Approach 2: International Business Machines Price vs Earnings
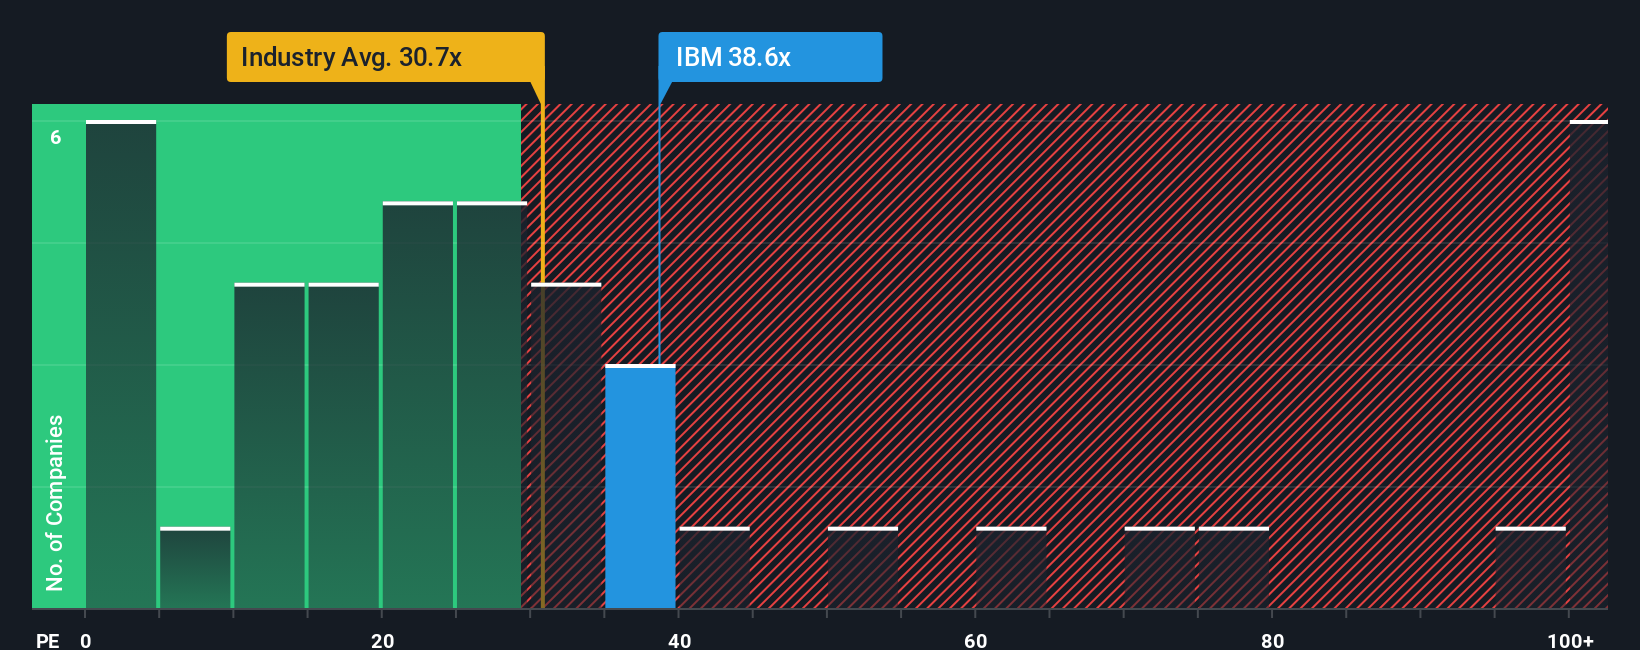
For profitable, established companies like International Business Machines, the Price to Earnings, or PE, ratio is a useful shorthand for how much investors are willing to pay today for each dollar of current earnings. It captures not only what the business is earning now, but also how the market feels about its future.
In practice, higher expected growth and lower perceived risk usually justify a higher, or more generous, PE multiple, while slower growth or higher risk tend to cap what investors will pay. IBM currently trades on a PE of about 35.8x, which is above both the broader IT industry average of roughly 29.8x and the selected peer group at around 22.2x. This implies the market is assigning IBM a premium versus many of its rivals.
Simply Wall St’s Fair Ratio framework goes a step further by estimating what PE multiple would be reasonable for IBM after factoring in its earnings growth outlook, profitability, industry, market value and risk profile. For IBM, that Fair Ratio sits around 39.3x, which is higher than the current market multiple. On this basis, while IBM looks expensive relative to peers, it still trades at a discount to what its fundamentals might justify.
Result: UNDERVALUED
PE ratios tell one story, but what if the real opportunity lies elsewhere? Discover 1457 companies where insiders are betting big on explosive growth.
Upgrade Your Decision Making: Choose your International Business Machines Narrative
Earlier we mentioned that there is an even better way to understand valuation, so let us introduce you to Narratives, a simple way to attach your story about International Business Machines to the numbers behind its future revenue, earnings and margins.
A Narrative is your structured view of the company. It is where you spell out how you think IBM’s hybrid cloud, AI and quantum strategy will play out, link that story to a financial forecast, and then arrive at your own Fair Value instead of relying only on static ratios.
On Simply Wall St’s Community page, millions of investors use Narratives as an accessible tool to decide when to buy or sell by comparing their Narrative based Fair Value to the current share price and seeing whether IBM looks attractively priced or stretched.
Because Narratives are updated dynamically as new news, earnings releases and estimates come in, your fair value view can automatically adjust when IBM announces, for example, a major AI win or a disappointing quarter.
For IBM today, one investor might build a bullish Narrative that assumes a Fair Value near $350 per share, while a more cautious investor could land closer to $198, and both perspectives can coexist transparently on the platform.
For International Business Machines, however, we will make it really easy for you with previews of two leading International Business Machines Narratives:
🐂 International Business Machines Bull Case
Fair Value: $350.00
Implied Upside vs Last Close: approximately 13.4% above $303.18
Revenue Growth Assumption: 6.14%
- Assumes IBM can capture outsized digital transformation budgets in regulated sectors through hybrid cloud, AI and modernization, supporting structurally higher growth and margins.
- Views the integration of Red Hat, HashiCorp and DataStax, plus quantum and automation innovation, as catalysts for a richer mix of high margin recurring software and stronger free cash flow.
- Accepts meaningful risks from legacy revenue decline, intense competition, open source disruption, talent constraints and elevated debt, but believes execution can still justify a premium valuation.
🐻 International Business Machines Bear Case
Fair Value: about $293.89
Implied Overvaluation vs Last Close: approximately 3.2% above $303.18
Revenue Growth Assumption: 5.16%
- Sees hybrid cloud, AI and acquisitions as solid but not transformational drivers, supporting mid single digit growth and margin improvement rather than a step change in performance.
- Highlights macro uncertainty, government and consulting exposure, and sensitivity of consumption based software to slowdowns as key constraints on upside.
- Concludes that with the share price already close to consensus fair value, IBM offers a more balanced risk reward profile unless growth or quantum monetization materially exceeds current expectations.
Do you think there's more to the story for International Business Machines? Head over to our Community to see what others are saying!

This article by Simply Wall St is general in nature. We provide commentary based on historical data and analyst forecasts only using an unbiased methodology and our articles are not intended to be financial advice. It does not constitute a recommendation to buy or sell any stock, and does not take account of your objectives, or your financial situation. We aim to bring you long-term focused analysis driven by fundamental data. Note that our analysis may not factor in the latest price-sensitive company announcements or qualitative material. Simply Wall St has no position in any stocks mentioned.
Have feedback on this article? Concerned about the content? Get in touch with us directly. Alternatively, email editorial-team@simplywallst.com