
Is S&P Global Still Attractive Near $500 After Years of Strong Share Price Gains
- Wondering if S&P Global is still worth buying at nearly $500 a share, or if most of the upside is already priced in? This article will unpack what the current share price is really implying about future growth and risk.
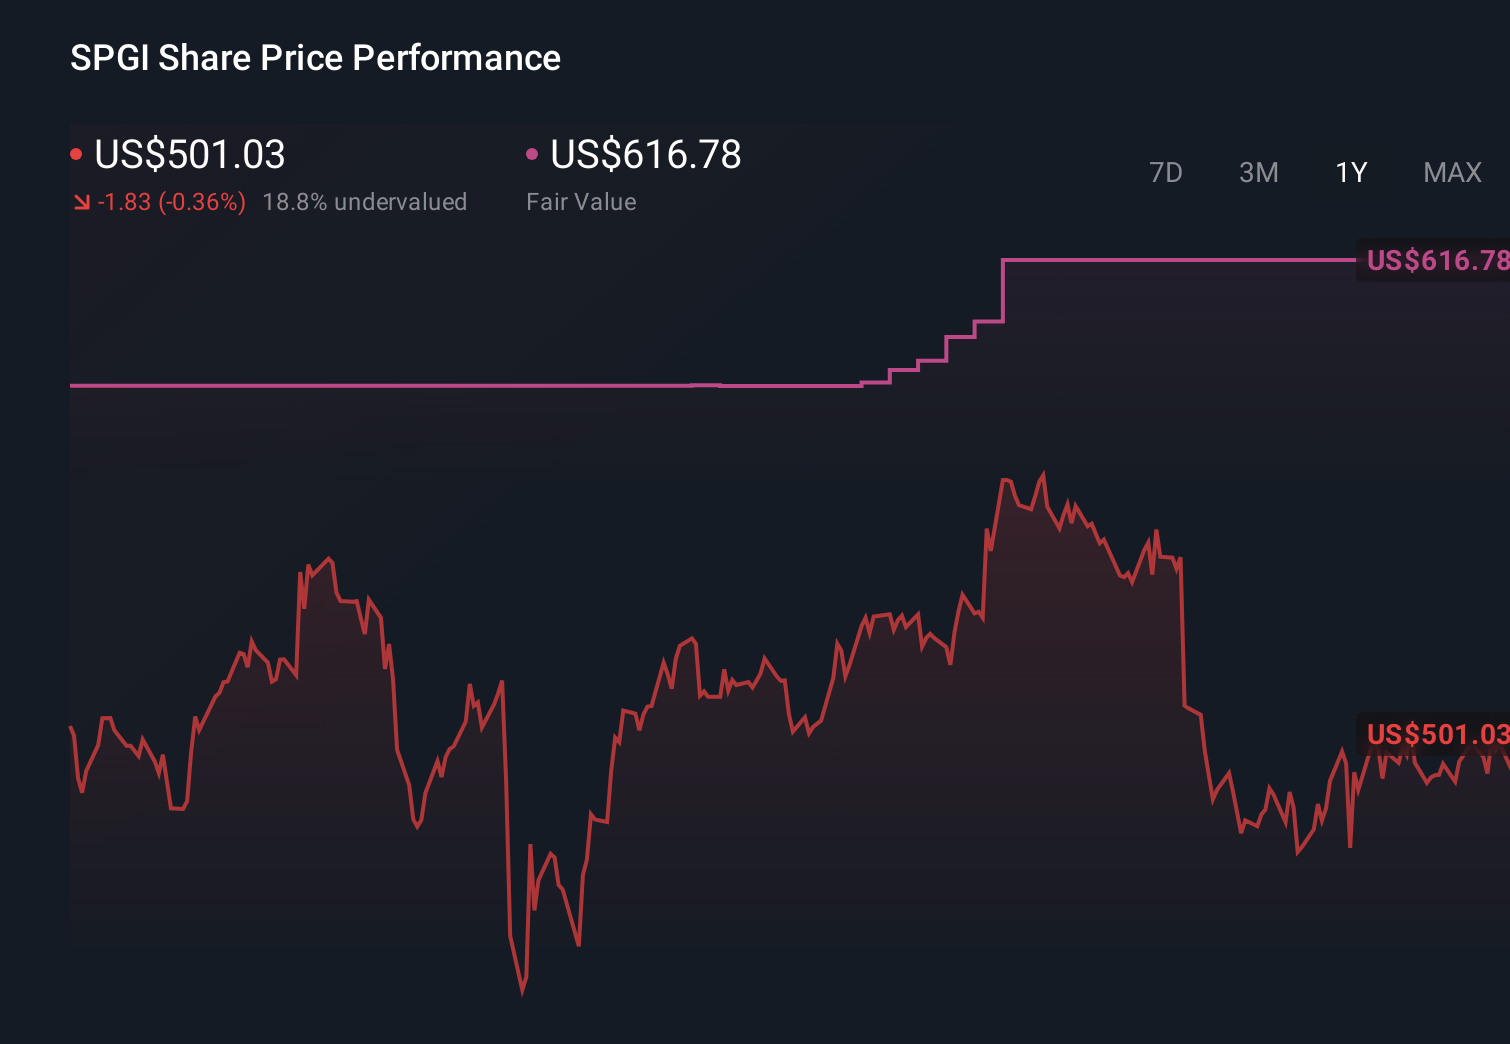
- The stock has inched up 1.9% over the last week and 1.2% over the past month, while longer term returns of 54.3% over three years and 63.4% over five years show why many investors already see it as a compounder.
- Recent attention has focused on S&P Global's ongoing role in credit ratings, benchmarks, and data services as markets digest shifting interest rate expectations and regulatory developments. At the same time, its index and data franchises continue to benefit from the structural rise of passive investing and demand for high quality market intelligence.
- Yet despite that backdrop, S&P Global only scores 1/6 on our valuation checks, which suggests the market may already be paying up for quality, growth, and stability. Next, we will walk through different valuation approaches to see whether the current price makes sense, before finishing with a more holistic way to think about what this business is really worth over the long run.
S&P Global scores just 1/6 on our valuation checks. See what other red flags we found in the full valuation breakdown.
Approach 1: S&P Global Excess Returns Analysis
The Excess Returns model looks at how much value S&P Global can create above the minimum return investors demand on its equity. Instead of focusing on cash flows, it compares the company’s profitability on shareholder capital with the cost of that capital to estimate long term value creation.
For S&P Global, the starting Book Value is $109.21 per share, rising to a Stable Book Value of $112.91 per share based on forecasts from five analysts. Using expected profitability, the model derives a Stable EPS of $19.52 per share, informed by return on equity estimates from four analysts. On the risk side, the Cost of Equity is $9.33 per share. The Excess Return, which is the economic profit above that hurdle, is $10.19 per share. That implies an Average Return on Equity of 17.29% on a steady state basis.
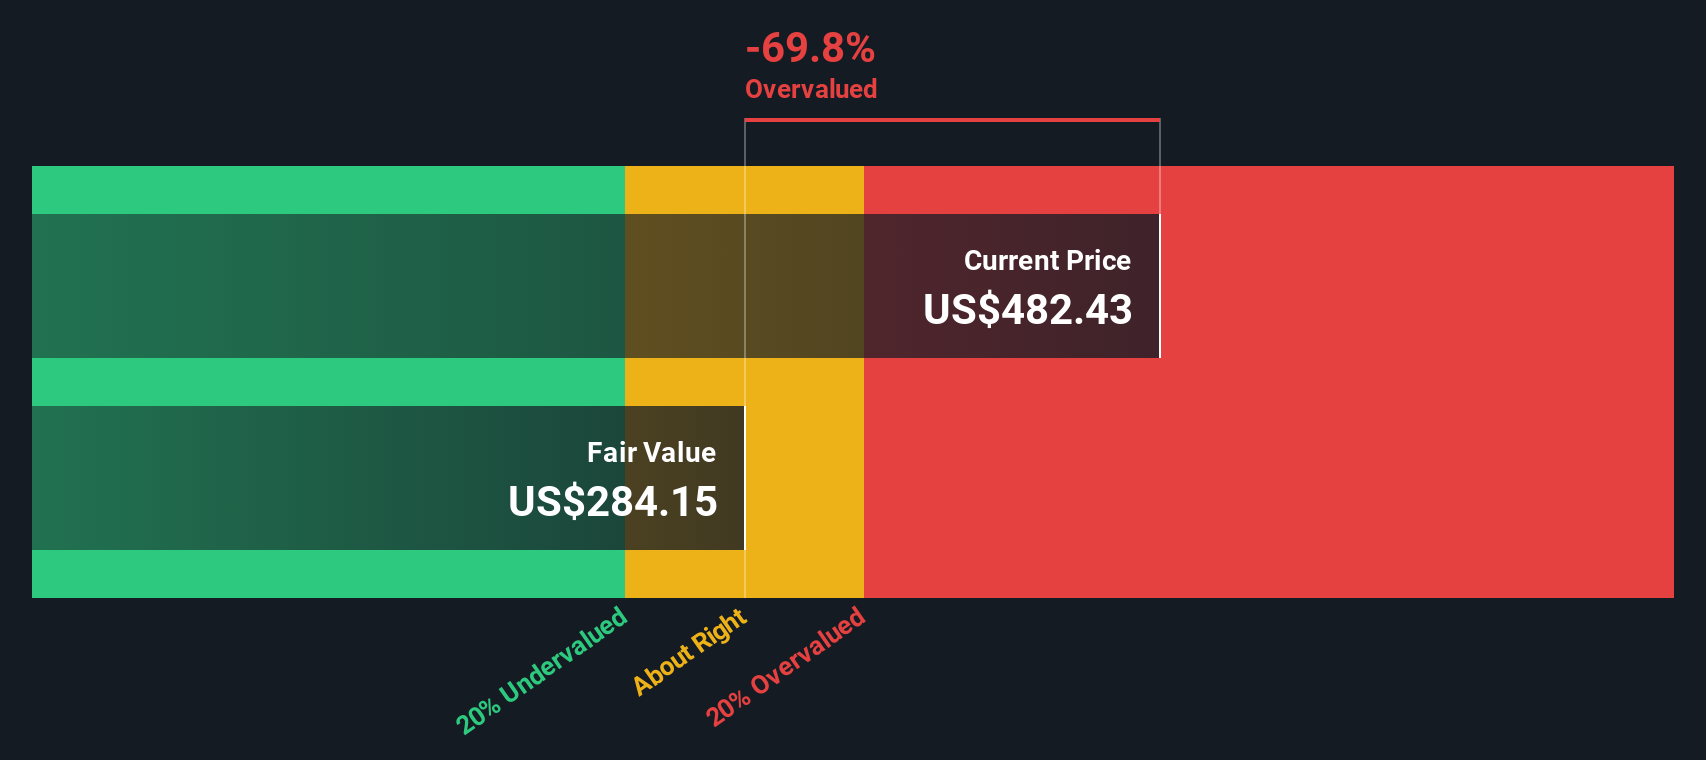
When these excess returns are projected forward and discounted, the model arrives at an intrinsic value of about $316.55 per share, implying the stock is roughly 57.9% overvalued at the current price.
Result: OVERVALUED
Our Excess Returns analysis suggests S&P Global may be overvalued by 57.9%. Discover 908 undervalued stocks or create your own screener to find better value opportunities.
Approach 2: S&P Global Price vs Earnings
For a consistently profitable business like S&P Global, the price to earnings, or PE, ratio is a useful way to judge valuation because it directly links what investors pay today to the company’s current earnings power. In general, higher expected earnings growth and lower perceived risk justify a higher PE, while slower growth or greater uncertainty call for a lower, more conservative multiple.
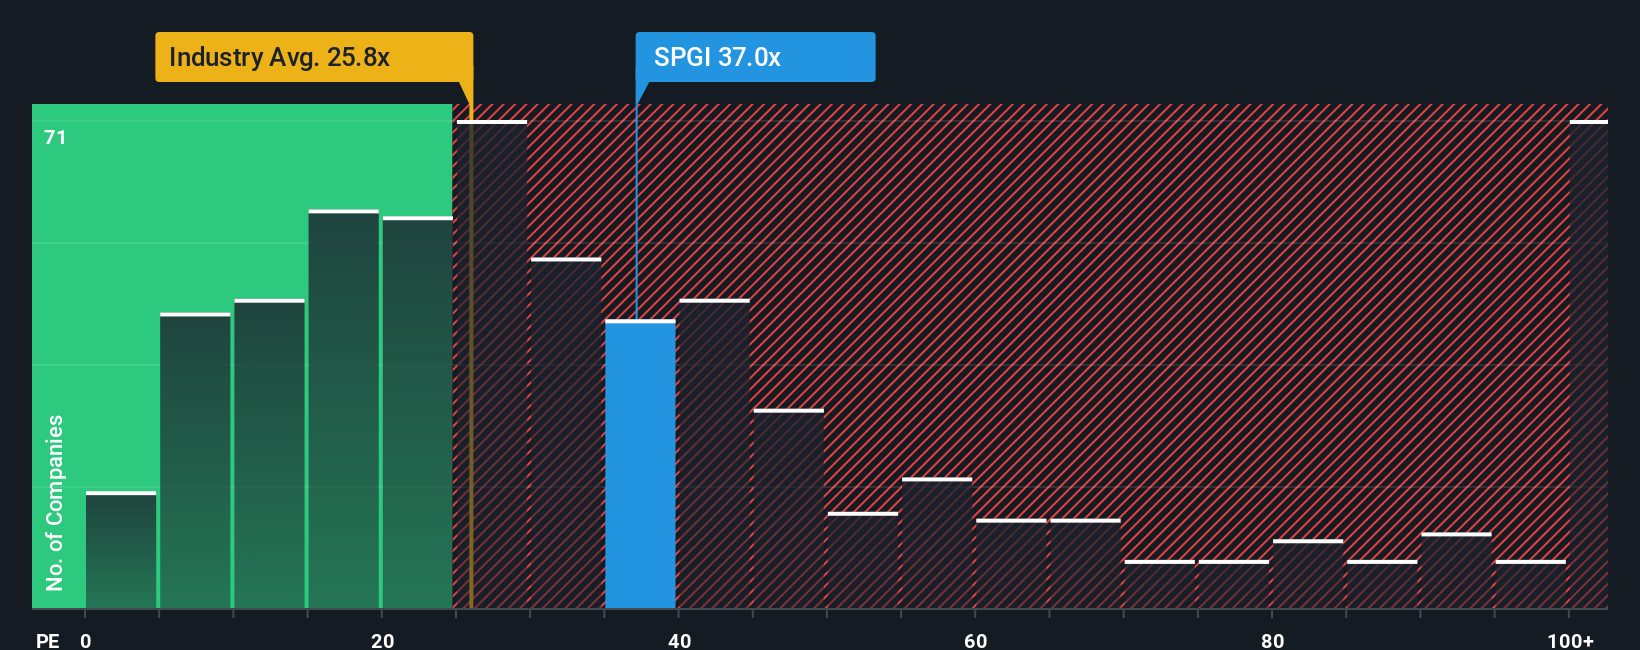
S&P Global currently trades at about 35.9x earnings. That sits well above the broader Capital Markets industry average of roughly 25.5x and also ahead of its peer group, which averages around 31.8x. On the surface, that premium suggests investors are already paying up for its quality and growth profile.
To go a step further, Simply Wall St’s Fair Ratio framework estimates what a more tailored PE should be, given S&P Global’s specific earnings growth outlook, margins, risk profile, industry, and market cap. This produces a Fair Ratio of about 17.8x, which is meaningfully lower than both the current 35.9x and simple peer or industry comparisons. That gap implies the stock is trading well above the level its fundamentals and risks would typically support.
Result: OVERVALUED
PE ratios tell one story, but what if the real opportunity lies elsewhere? Discover 1457 companies where insiders are betting big on explosive growth.
Upgrade Your Decision Making: Choose your S&P Global Narrative
Earlier we mentioned that there is an even better way to understand valuation, so let us introduce you to Narratives, a simple framework that lets you attach a clear story to your numbers by spelling out what you believe about a company’s future revenue, earnings, and margins, and then translating that view into a fair value estimate. A Narrative connects three pieces together: the business story you believe in, the financial forecast that follows from that story, and the fair value that those cash flows and risks imply. On Simply Wall St’s Community page, used by millions of investors, you can easily explore and create these Narratives, then compare each Narrative’s Fair Value with the current share price to see whether it points to a buy, hold, or sell decision. Narratives automatically refresh as new information like earnings releases or major news arrives, so your view stays dynamic instead of static. For example, one S&P Global Narrative might assume moderate revenue growth and a conservative discount rate that leads to a lower fair value, while another could project faster growth and resilient margins that support a much higher fair value.
Do you think there's more to the story for S&P Global? Head over to our Community to see what others are saying!
This article by Simply Wall St is general in nature. We provide commentary based on historical data and analyst forecasts only using an unbiased methodology and our articles are not intended to be financial advice. It does not constitute a recommendation to buy or sell any stock, and does not take account of your objectives, or your financial situation. We aim to bring you long-term focused analysis driven by fundamental data. Note that our analysis may not factor in the latest price-sensitive company announcements or qualitative material. Simply Wall St has no position in any stocks mentioned.
Have feedback on this article? Concerned about the content? Get in touch with us directly. Alternatively, email editorial-team@simplywallst.com