
Is It Too Late To Consider Barrick After Its 156.6% Year To Date Surge?
- If you are wondering whether Barrick Mining remains attractive after its big run up, or if you are late to the party, this breakdown will help you evaluate whether the current price still offers real value.
- The stock has climbed 4.2% over the last week and 13.5% over the past month, while its 156.6% year to date and 159.3% one year returns have significantly changed how the market is looking at it.
- That surge has come alongside renewed investor focus on gold producers as a hedge against uncertainty, as well as upbeat commentary around Barrick Mining's project pipeline and balance sheet strength. Together, those themes have fueled a rerating of the shares and raised fresh questions about how much upside is left from here.
- Based on our analysis, Barrick Mining scores a 5 out of 6 on key undervaluation checks. This places it firmly in the "potentially still attractive" camp. Below, we outline the main valuation perspectives investors commonly use today, followed by a broader way to think about what the stock may be worth.
Approach 1: Barrick Mining Discounted Cash Flow (DCF) Analysis
A Discounted Cash Flow model estimates what a business is worth by projecting the cash it can generate in the future and then discounting those cash flows back to today.
For Barrick Mining, the latest twelve month free cash flow stands at about $2.57 billion, providing a base for the valuation. Analysts and model assumptions then project free cash flow rising to roughly $13.46 billion in 2035, with growth stronger in the next few years before moderating over time. Estimates out to 2029 are informed by analyst forecasts, while later years are extrapolated using Simply Wall St assumptions to create a smooth long term trajectory.
When all these projected cash flows are discounted back to today using a 2 Stage Free Cash Flow to Equity model, the resulting intrinsic value is about $175.60 per share. Compared with the current market price, this implies the shares are approximately 66.4% undervalued, indicating a substantial margin of safety if the projected cash flow path is achieved.
Result: UNDERVALUED
Our Discounted Cash Flow (DCF) analysis suggests Barrick Mining is undervalued by 66.4%. Track this in your watchlist or portfolio, or discover 915 more undervalued stocks based on cash flows.
Approach 2: Barrick Mining Price vs Earnings
For profitable, established companies like Barrick Mining, the price to earnings, or PE, ratio is a straightforward way to gauge whether investors are paying a reasonable price for each dollar of current earnings. What counts as a fair PE depends on how quickly earnings are expected to grow and how risky those earnings are, with higher growth and lower risk typically justifying a higher multiple.
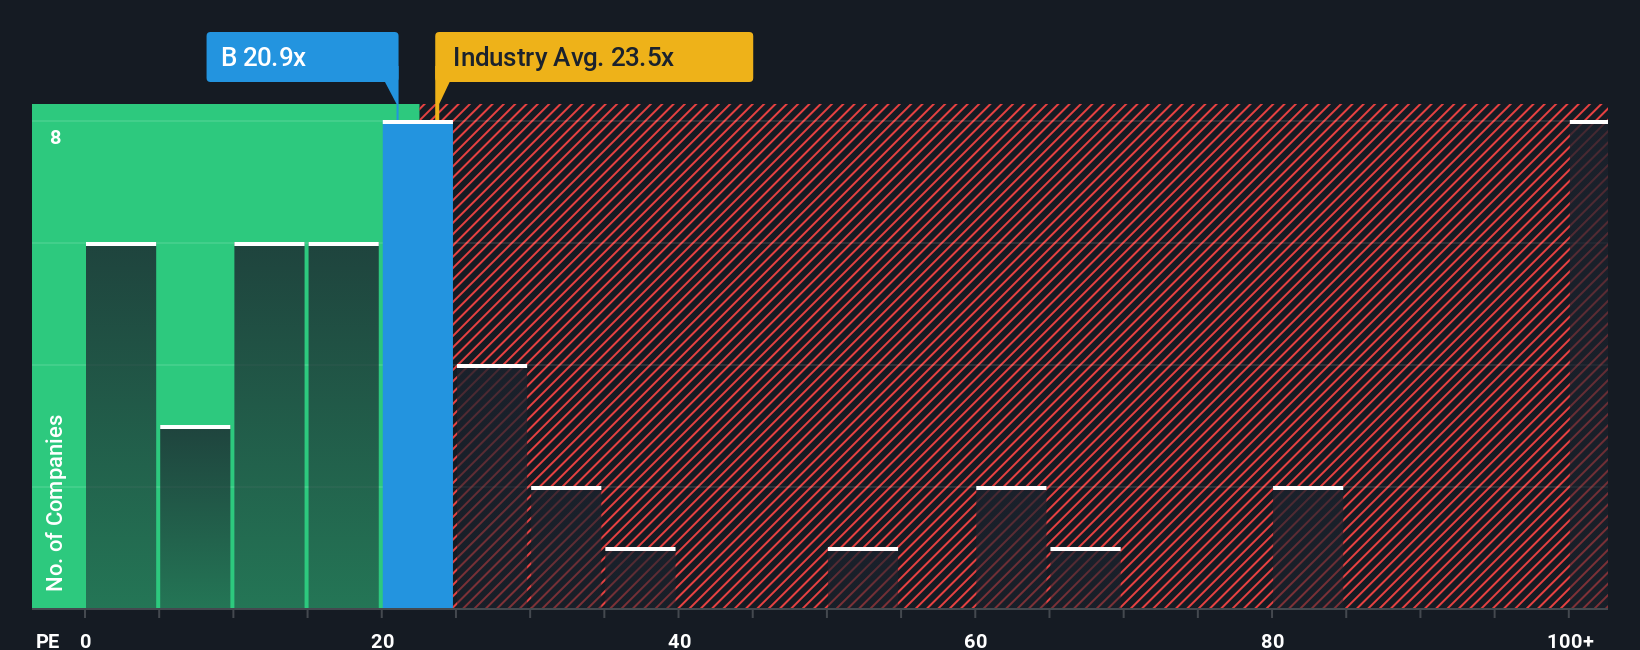
Barrick Mining currently trades on a PE of 20.21x. That sits just below the broader Metals and Mining industry average of around 21.23x, and at a clear discount to a peer group average of about 35.95x, suggesting the market is not assigning Barrick a premium despite its recent momentum.
Simply Wall St’s Fair Ratio framework goes a step further by estimating what PE multiple Barrick should trade on given its earnings growth outlook, margins, industry positioning, size, and risk profile. This proprietary Fair Ratio for Barrick is 24.51x, indicating the shares deserve a modestly higher multiple than they currently command. Because this approach is tailored to the company’s specific fundamentals rather than broad peer comparisons, it offers a more nuanced view of value and implies that Barrick still looks undervalued on an earnings basis.
Result: UNDERVALUED
PE ratios tell one story, but what if the real opportunity lies elsewhere? Discover 1460 companies where insiders are betting big on explosive growth.
Upgrade Your Decision Making: Choose your Barrick Mining Narrative
Earlier we mentioned that there is an even better way to understand valuation, so let us introduce you to Narratives, which are simple stories you create about a company that sit behind your numbers, tying your assumptions for future revenue, earnings and margins to a clear fair value estimate.
On Simply Wall St, Narratives live in the Community page and are designed to be approachable for any investor, because they link a company’s story, such as why gold demand might rise or how new copper projects could boost profits, directly to a financial forecast and a fair value you can compare to today’s share price to help you decide how to approach the stock.
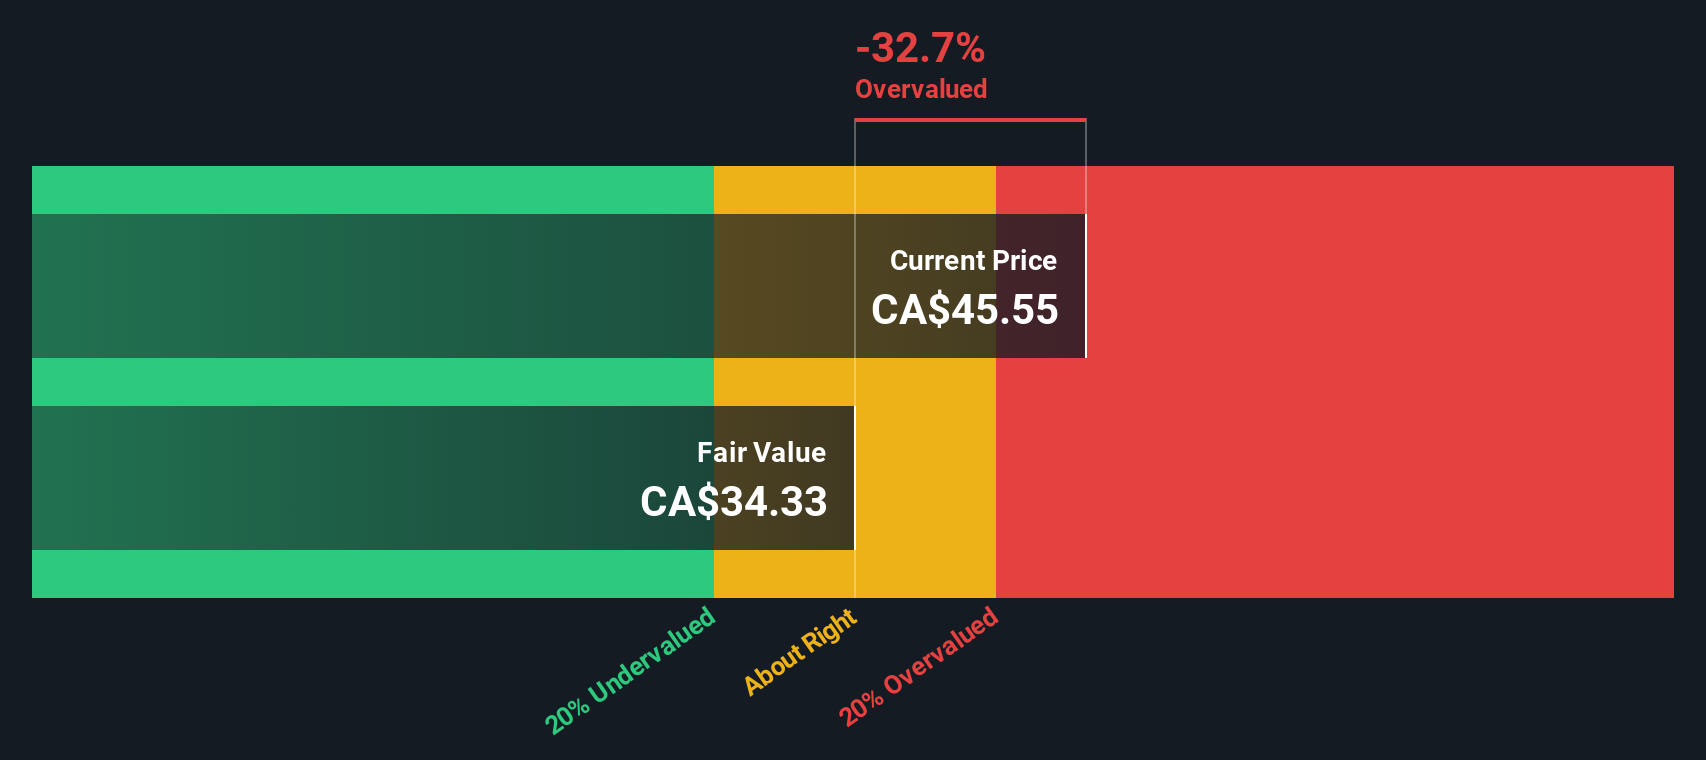
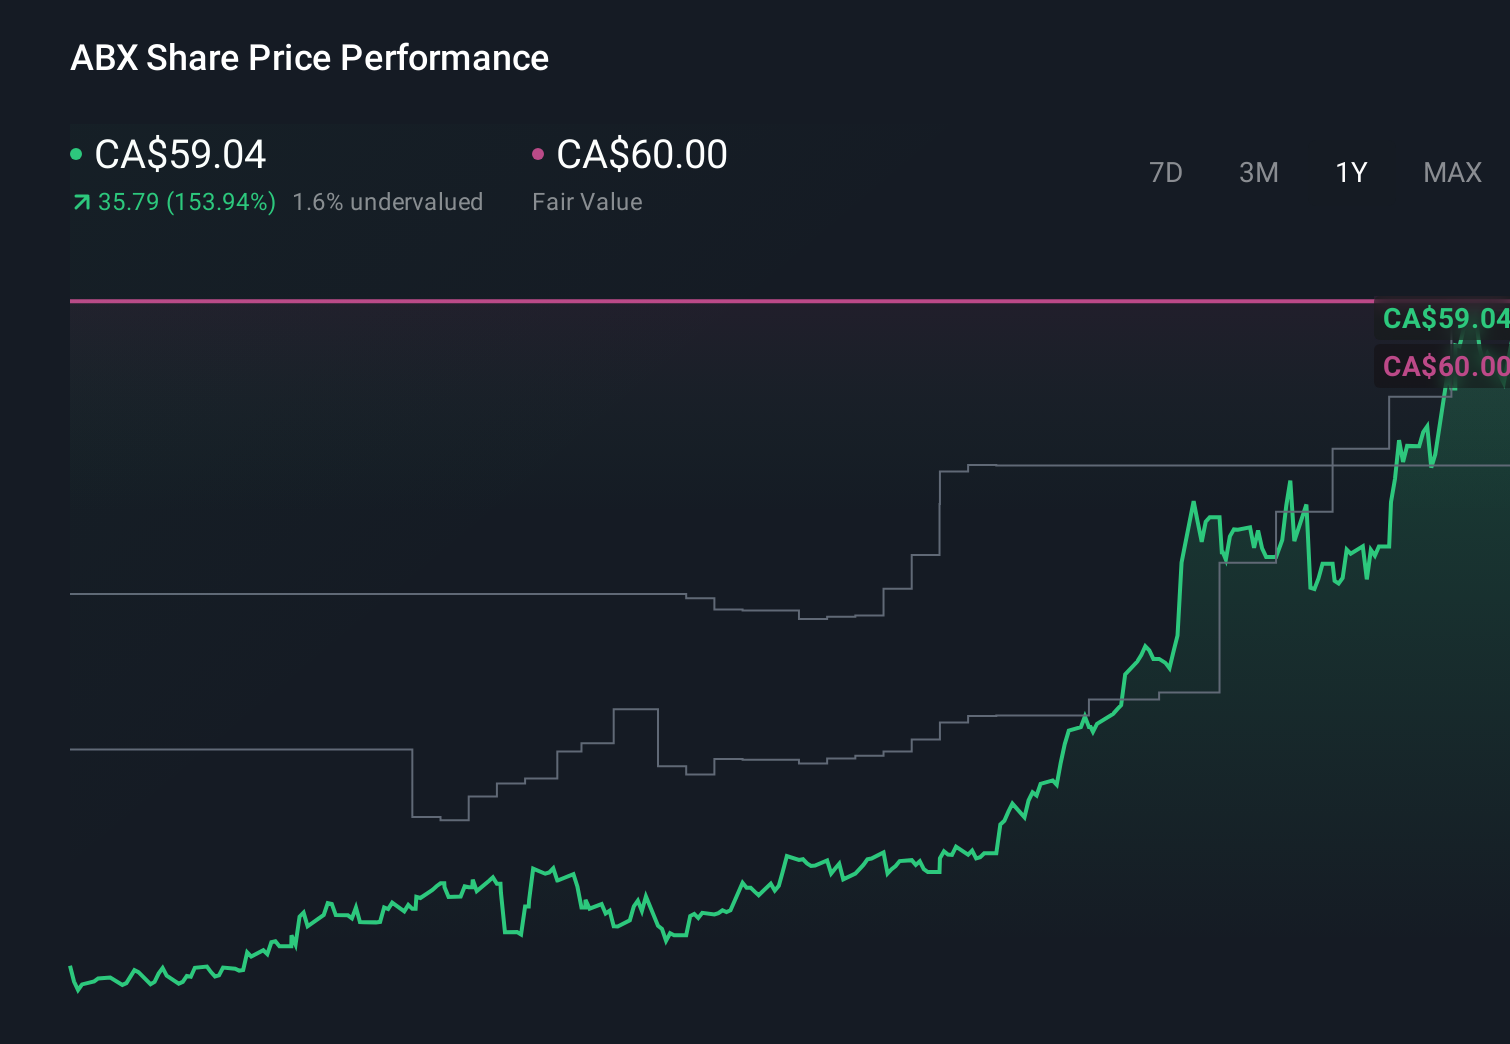
These Narratives update dynamically as fresh information like news, earnings and guidance comes in, helping you keep your view current. With Barrick Mining, you can already see very different perspectives in action, from one Narrative that views it as modestly undervalued around CAD 55 to 60 on the back of safe haven gold demand, to another that sees fair value closer to the low 30s unless growth, margins and political risks play out exactly as expected.
Do you think there's more to the story for Barrick Mining? Head over to our Community to see what others are saying!
This article by Simply Wall St is general in nature. We provide commentary based on historical data and analyst forecasts only using an unbiased methodology and our articles are not intended to be financial advice. It does not constitute a recommendation to buy or sell any stock, and does not take account of your objectives, or your financial situation. We aim to bring you long-term focused analysis driven by fundamental data. Note that our analysis may not factor in the latest price-sensitive company announcements or qualitative material. Simply Wall St has no position in any stocks mentioned.
Have feedback on this article? Concerned about the content? Get in touch with us directly. Alternatively, email editorial-team@simplywallst.com