
Is JBS Stock Mispriced After Recent Gains and Ongoing Operational Streamlining Efforts?
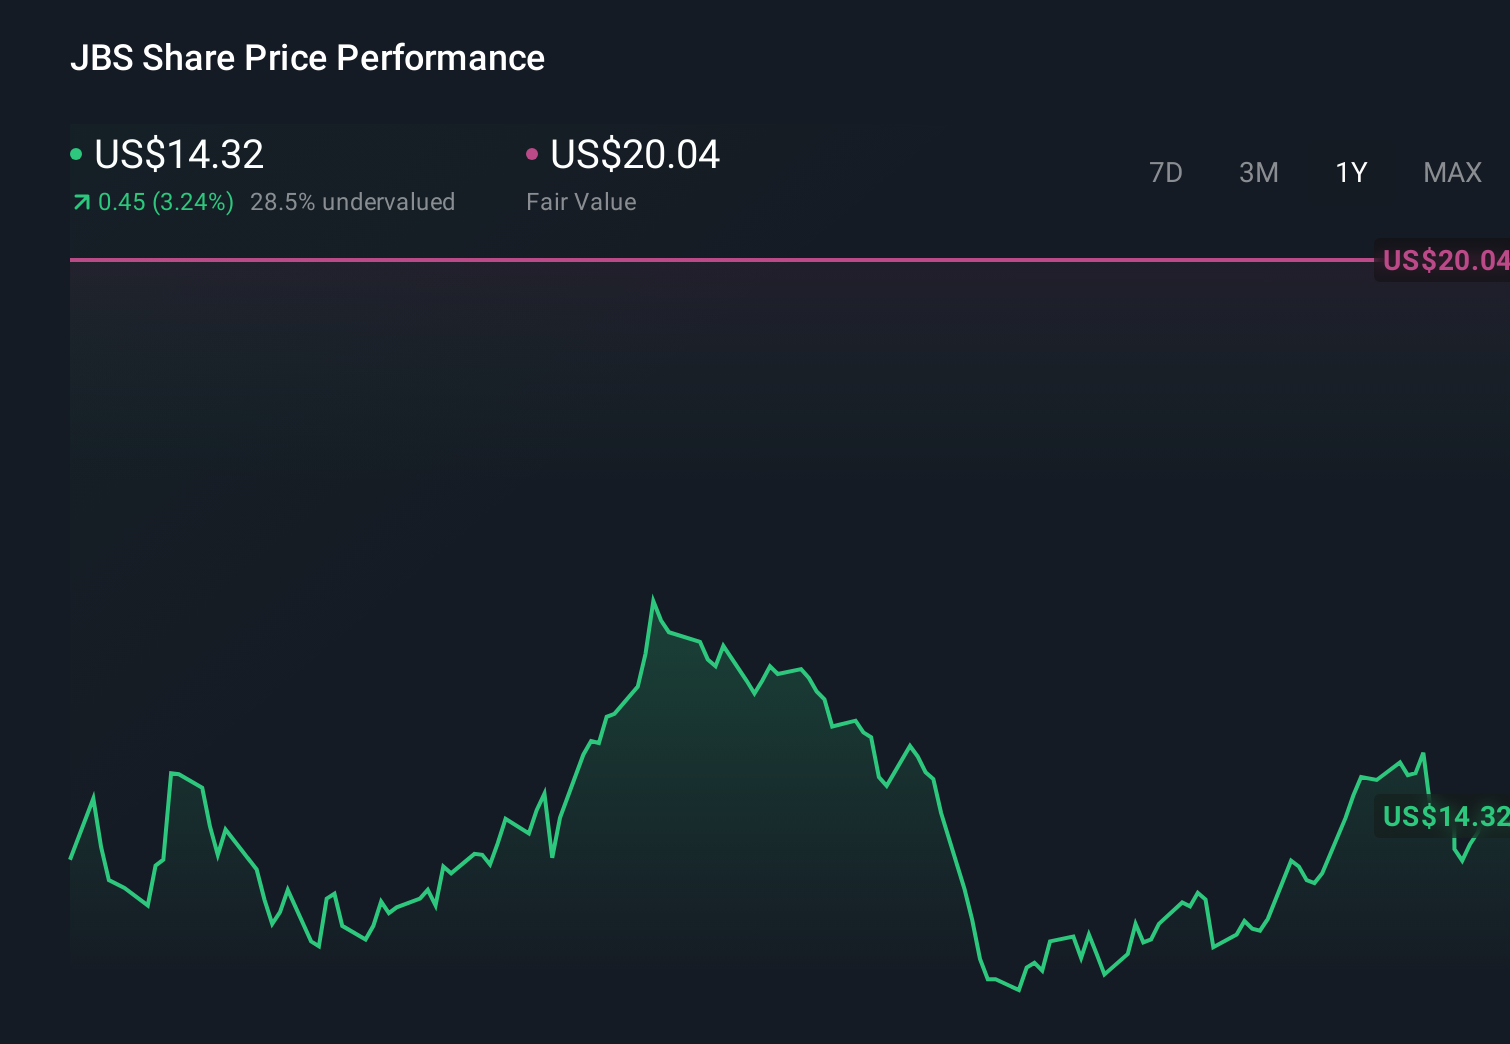
- Wondering if JBS at around $14.34 is quietly trading below what it is really worth? You are not alone, and this breakdown is designed to help you decide if the stock deserves a spot on your watchlist.
- Over the last week JBS is up 3.5%, building on an 8.1% gain over the past month and a 3.4% rise year to date. These moves hint that investors are starting to reassess the company’s risk and growth profile.
- Recent headlines have focused on JBS’s ongoing push to streamline operations and invest in higher margin segments, alongside continued scrutiny of its global supply chain practices. Together, these developments are shaping how the market is rethinking both the company’s long term earnings power and its risk premium.
- On our checklist of six valuation tests, JBS scores a perfect 6 out of 6. We will unpack this using multiple valuation approaches before circling back at the end to an even better way of thinking about what “fair value” really means for this stock.
Approach 1: JBS Discounted Cash Flow (DCF) Analysis
A Discounted Cash Flow model estimates what a business is worth by projecting the cash it can generate in the future and discounting those cash flows back to today using an appropriate risk adjusted rate.
For JBS, the model starts with last twelve month free cash flow of about $915.7 Million, then uses analyst forecasts and extrapolations by Simply Wall St to map out how this could grow. By 2029, free cash flow is projected to reach roughly $3.7 Billion, with further growth taking it above $5 Billion by 2035. This illustrates expectations for a steadily expanding cash generating base.
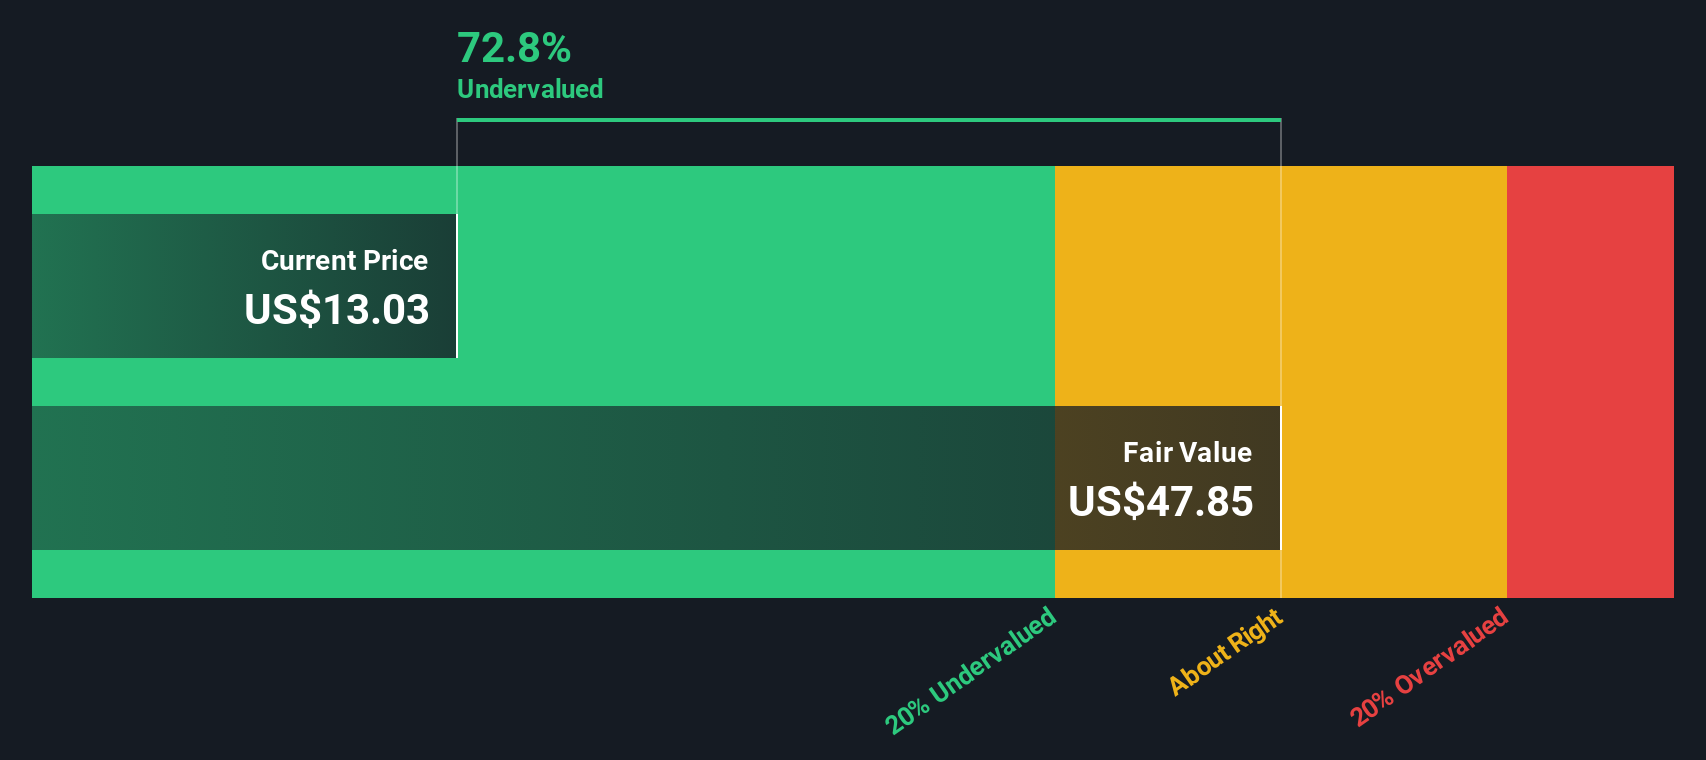
When those projected cash flows are discounted back and summed under a 2 Stage Free Cash Flow to Equity framework, the implied intrinsic value for JBS comes out at about $88.52 per share. Against a current share price of roughly $14.34, the model indicates the stock is around 83.8% undervalued, implying a wide margin of safety if the cash flow path proves accurate.
Result: UNDERVALUED
Our Discounted Cash Flow (DCF) analysis suggests JBS is undervalued by 83.8%. Track this in your watchlist or portfolio, or discover 909 more undervalued stocks based on cash flows.
Approach 2: JBS Price vs Earnings
For a consistently profitable business like JBS, the price to earnings ratio is a straightforward way to gauge how much investors are paying for each dollar of current earnings. In general, companies with stronger and more reliable growth prospects, and lower perceived risk, tend to justify a higher PE multiple, while slower growing or riskier firms should trade on lower multiples.
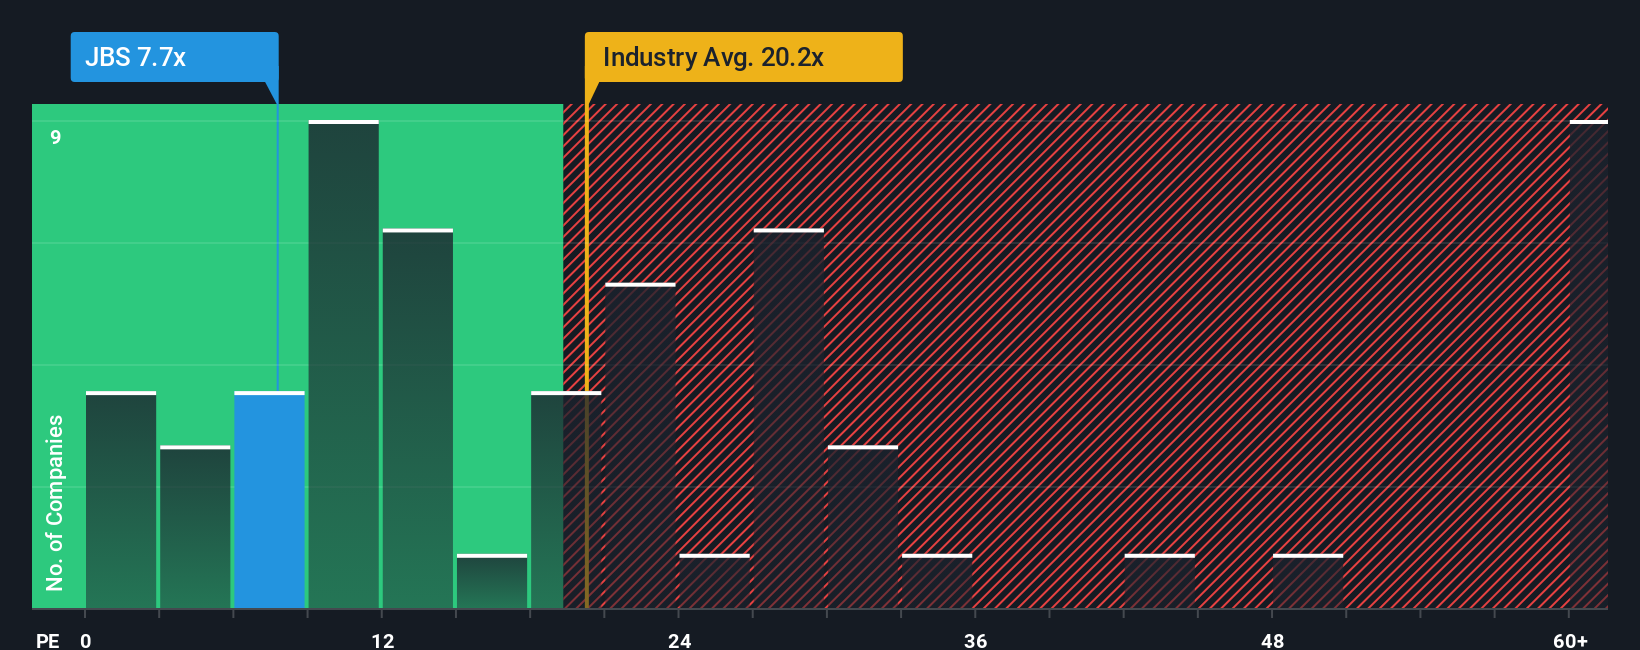
JBS currently trades at about 7.7x earnings, which is well below both the Food industry average of roughly 19.9x and a broader peer group average near 25.7x. Simply Wall St also calculates a Fair Ratio of around 16.4x for JBS, a proprietary estimate of what its PE should be given its earnings growth profile, margins, industry, market cap and identified risks. This tailored Fair Ratio is more informative than simple peer comparisons because it explicitly adjusts for JBS specific fundamentals rather than assuming it should trade like the average company in its sector.
Comparing the current 7.7x PE with the 16.4x Fair Ratio suggests that, on an earnings multiple basis, JBS still appears meaningfully undervalued.
Result: UNDERVALUED
PE ratios tell one story, but what if the real opportunity lies elsewhere? Discover 1463 companies where insiders are betting big on explosive growth.
Upgrade Your Decision Making: Choose your JBS Narrative
Earlier we mentioned that there is an even better way to understand valuation, so let us introduce you to Narratives, a simple way to connect your view of a company’s story with the numbers that drive its fair value. A Narrative captures your perspective on JBS’s future, including what you believe about its revenue growth, profit margins and risks, and turns that into a clear financial forecast and fair value estimate. On Simply Wall St, millions of investors build and refine Narratives on the Community page, using them as an accessible tool to see whether a stock looks undervalued or overvalued by comparing their Fair Value to the current market price. Because Narratives on the platform update automatically when new information like earnings reports or major news is released, your valuation view can evolve in real time without complex manual modeling. For example, one JBS Narrative might assume strong margin expansion and assign a very high fair value, while a more cautious Narrative could project flat earnings and arrive at a far lower fair value, giving each investor a tailored way to apply their own view of whether to buy, hold or sell.
Do you think there's more to the story for JBS? Head over to our Community to see what others are saying!
This article by Simply Wall St is general in nature. We provide commentary based on historical data and analyst forecasts only using an unbiased methodology and our articles are not intended to be financial advice. It does not constitute a recommendation to buy or sell any stock, and does not take account of your objectives, or your financial situation. We aim to bring you long-term focused analysis driven by fundamental data. Note that our analysis may not factor in the latest price-sensitive company announcements or qualitative material. Simply Wall St has no position in any stocks mentioned.
Have feedback on this article? Concerned about the content? Get in touch with us directly. Alternatively, email editorial-team@simplywallst.com