
Has IAMGOLD’s 173% Surge in 2025 Already Priced In Its Cash Flow Potential
- If you are wondering whether IAMGOLD has already run too far or if there is still real value left on the table, you are not alone. That is exactly what this breakdown is going to unpack.
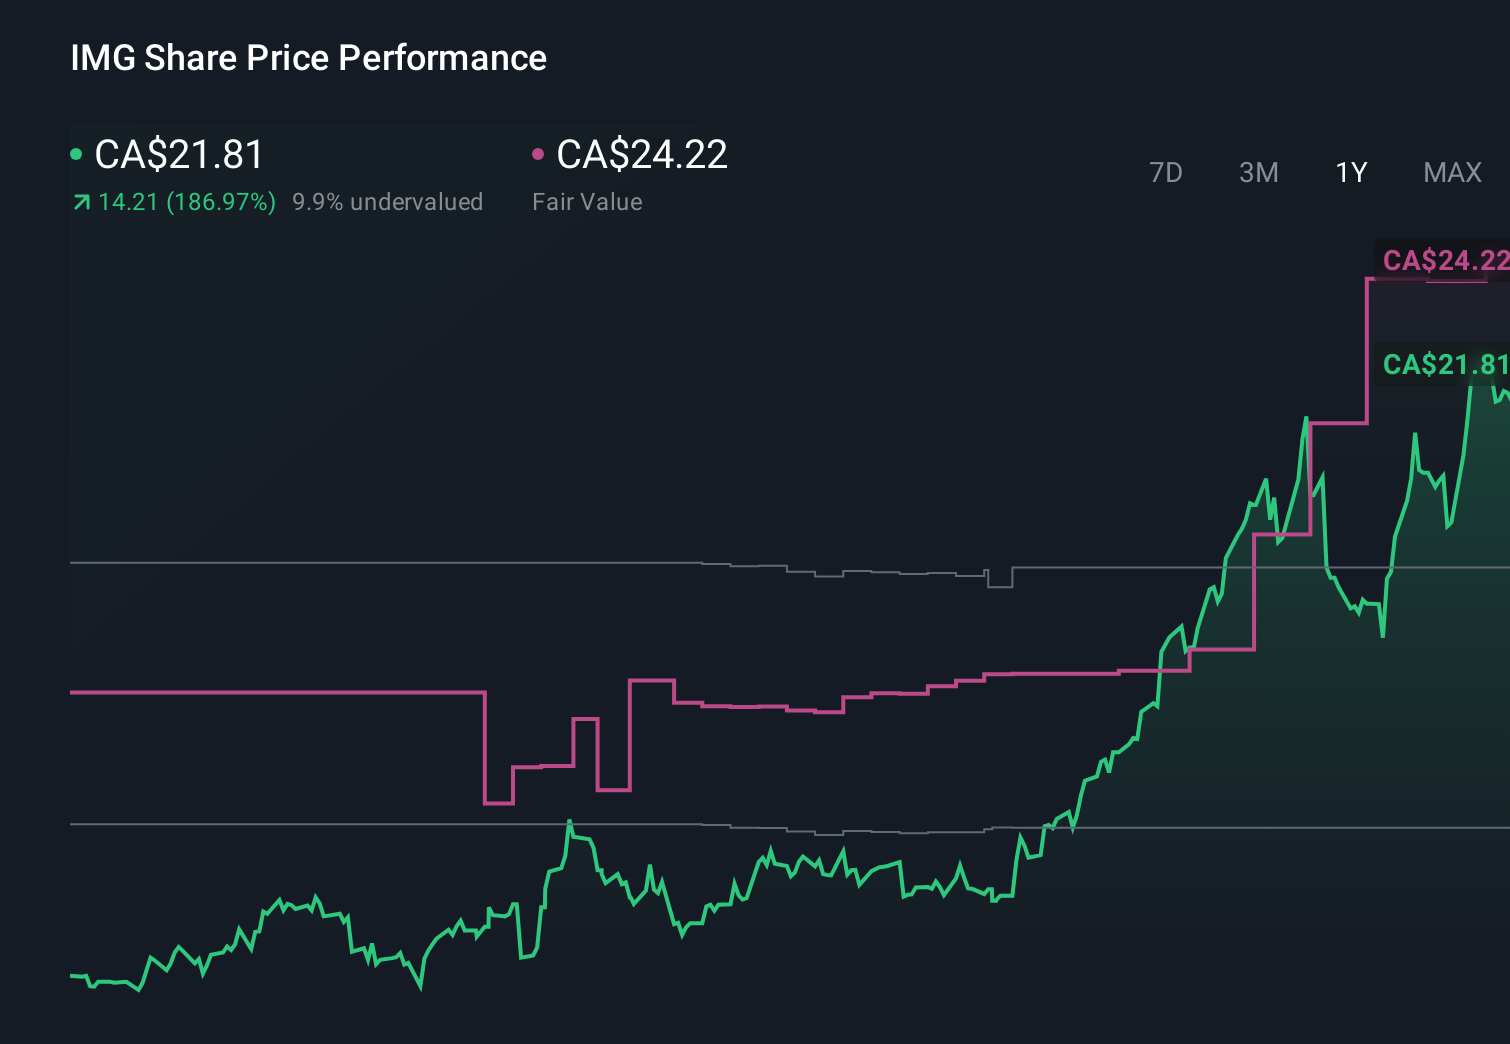
- The stock has been on a tear, with gains of 4.1% over the last week, 13.5% over the past month, and 172.8% year to date, building on a 187.9% 1 year return and over 600% in 3 years.
- Recent moves have been driven by a combination of stronger gold price sentiment and investor optimism around IAMGOLD's growth pipeline and operational execution. These factors have shifted how the market is pricing both its near term risk and longer term potential.
- Even after this run, IAMGOLD scores 4 out of 6 on our valuation checks. This suggests there may still be mispricing to explore using different valuation approaches. We will also close by looking at another way to think about what the stock may be worth.
Approach 1: IAMGOLD Discounted Cash Flow (DCF) Analysis
The Discounted Cash Flow model estimates what a company is worth by projecting the cash it can generate in the future and discounting those cash flows back to today to account for risk and time.
For IAMGOLD, the latest twelve month free cash flow stands at approximately $457.5 million, and it is negative, reflecting heavy investment and ramp up spending. Analysts then forecast an increase, with free cash flow expected to reach about $1.43 billion by 2028. Beyond the formal analyst window, additional yearly projections out to 2035 are extrapolated using Simply Wall St’s 2 Stage Free Cash Flow to Equity framework, gradually normalising growth as the business matures.
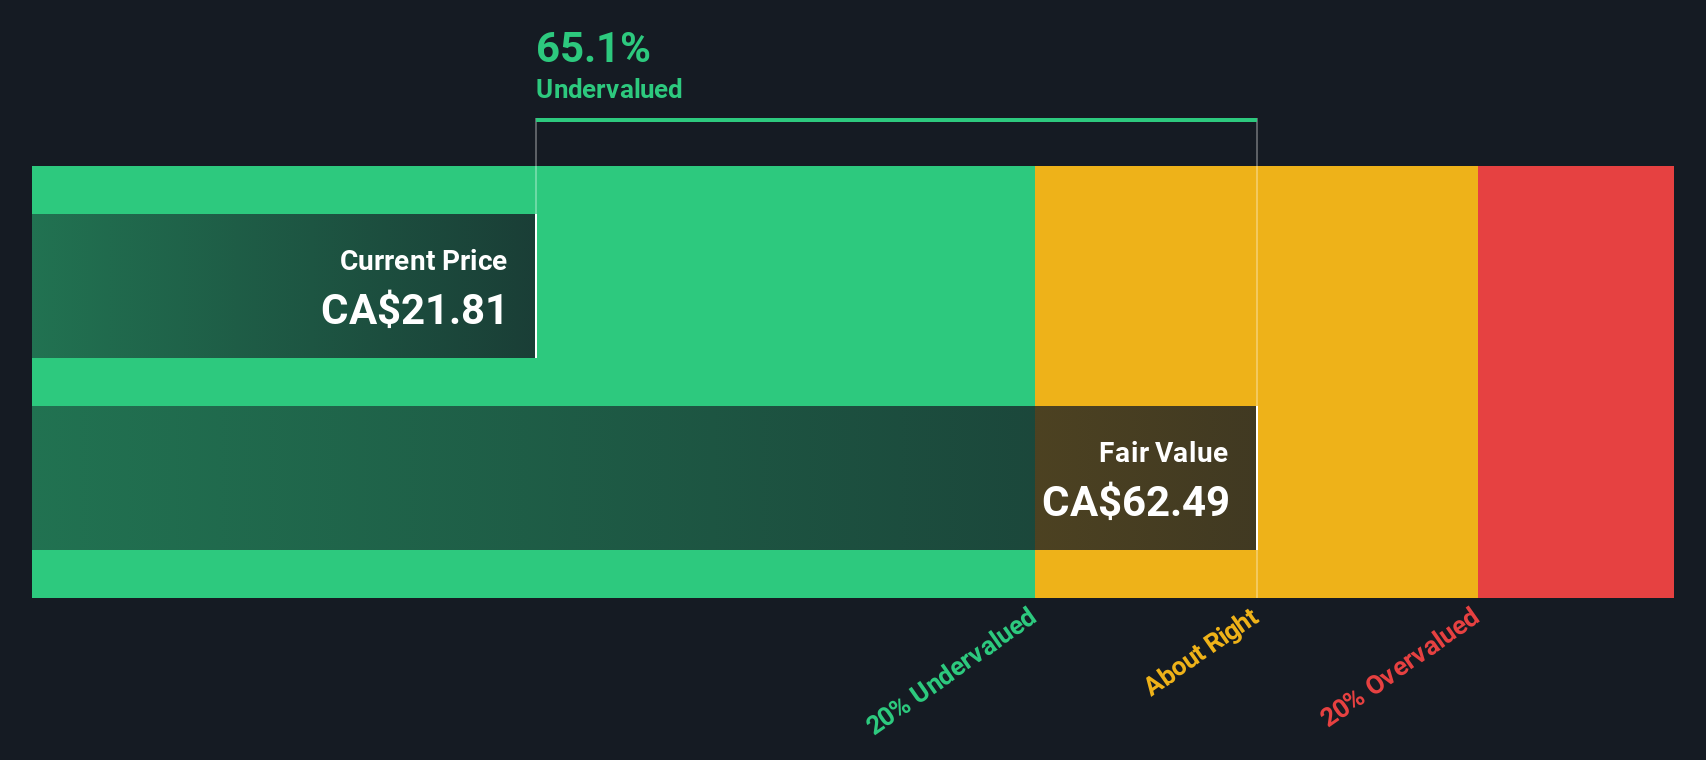
Bringing all of those projected cash flows back to today results in an estimated intrinsic value of roughly $62.55 per share. Compared to the current share price, this implies the stock is trading at about a 65.0% discount.
Result: UNDERVALUED
Our Discounted Cash Flow (DCF) analysis suggests IAMGOLD is undervalued by 65.0%. Track this in your watchlist or portfolio, or discover 910 more undervalued stocks based on cash flows.
Approach 2: IAMGOLD Price vs Earnings
For a company that is generating profits, the price to earnings ratio, or PE, is a straightforward way to gauge how much investors are willing to pay today for each dollar of current earnings. What counts as a reasonable PE depends on how fast those earnings are expected to grow and how risky or cyclical the business is, with higher growth and lower perceived risk usually supporting a higher multiple.
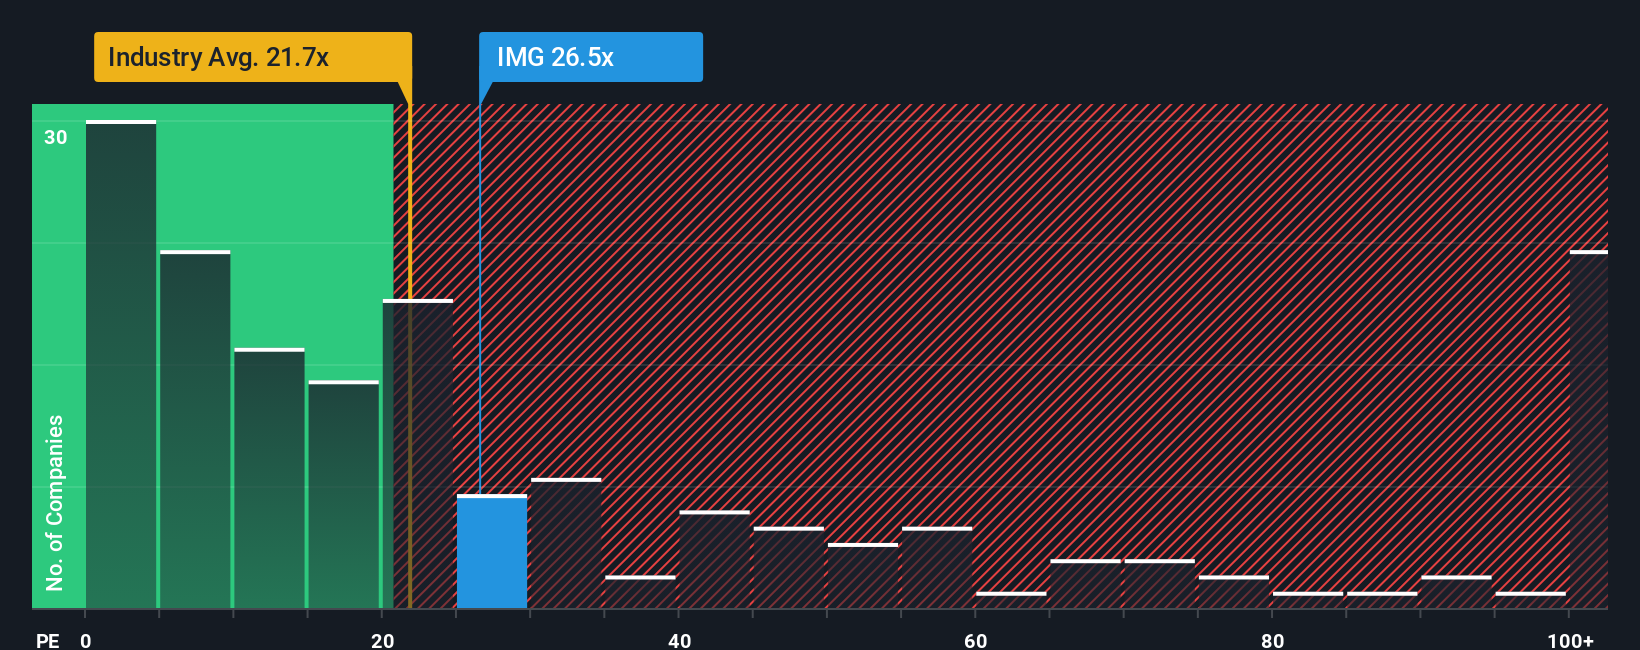
IAMGOLD currently trades on a PE of about 26.6x, which is above the Metals and Mining industry average of roughly 21.2x and below the average of its closest peers at about 62.9x. To move beyond simple comparisons, Simply Wall St calculates a proprietary “Fair Ratio,” which estimates the PE you would expect for IAMGOLD given its specific mix of earnings growth, risk profile, profit margins, industry and market cap. Because it is tailored to the company, this Fair Ratio is more informative than just lining IAMGOLD up against broad industry or peer averages.
IAMGOLD’s Fair Ratio is estimated at 38.5x, notably higher than its current 26.6x, suggesting the shares still trade at a discount to what its fundamentals might justify.
Result: UNDERVALUED
PE ratios tell one story, but what if the real opportunity lies elsewhere? Discover 1463 companies where insiders are betting big on explosive growth.
Upgrade Your Decision Making: Choose your IAMGOLD Narrative
Earlier we mentioned that there is an even better way to understand valuation, so let us introduce you to Narratives. These are simple stories investors build on Simply Wall St’s Community page to connect their view of a company’s future revenue, earnings and margins to a financial forecast and, ultimately, a Fair Value. This can then be compared with the current share price to decide whether to buy, hold or sell. Everything then updates automatically as new news or earnings are released. For example, one IAMGOLD investor might build a bullish Narrative around accelerating production, successful drilling and buybacks that supports a Fair Value closer to the high analyst target of about CA$16.48. Another, more cautious investor may focus on rising costs, asset concentration and geopolitical risk to justify a Fair Value nearer the low target of roughly CA$10.99. Each investor is turning their personal story into a clear, dynamic valuation anchor rather than relying only on static PE ratios or headline price targets.
Do you think there's more to the story for IAMGOLD? Head over to our Community to see what others are saying!
This article by Simply Wall St is general in nature. We provide commentary based on historical data and analyst forecasts only using an unbiased methodology and our articles are not intended to be financial advice. It does not constitute a recommendation to buy or sell any stock, and does not take account of your objectives, or your financial situation. We aim to bring you long-term focused analysis driven by fundamental data. Note that our analysis may not factor in the latest price-sensitive company announcements or qualitative material. Simply Wall St has no position in any stocks mentioned.
Have feedback on this article? Concerned about the content? Get in touch with us directly. Alternatively, email editorial-team@simplywallst.com