
Has Chevron’s Recent Share Slip Opened the Door to a 2025 Value Opportunity?
- If you are wondering whether Chevron is still a smart buy at around $146 a share, or if most of the upside has already been priced in, you are not alone in trying to make sense of its current valuation.
- Over the last month the stock has slipped about 6.9%, leaving year-to-date returns roughly flat at 0.0% and the 1-year gain at a modest 3.7%. This suggests that the market is still undecided on Chevron's next significant move.
- Recently, Chevron has stayed in the spotlight as investors debate the long-term impact of energy transition policies and shifting oil price expectations on the majors. At the same time, ongoing discussions around large-scale capital projects and industry consolidation have kept sentiment moving between optimism about future cash flows and caution about cyclical risk.
- On our checks, Chevron scores a 3 out of 6 valuation score, suggesting it appears undervalued on some metrics but not compelling across the board. Next, we will break down the key valuation approaches analysts use and then return to a more robust way of assessing what the stock may be worth.
Approach 1: Chevron Discounted Cash Flow (DCF) Analysis
A Discounted Cash Flow, or DCF, model estimates what a company is worth by projecting the cash it can generate in the future and then discounting those dollars back to today in dollar terms.
For Chevron, the model starts from last twelve month free cash flow of about $16.3 billion, then uses analyst forecasts for the next several years and extrapolates further out. Under this 2 Stage Free Cash Flow to Equity approach, cash flows are expected to climb toward roughly $33.5 billion by 2035, reflecting steady, though moderating, growth as the business matures.
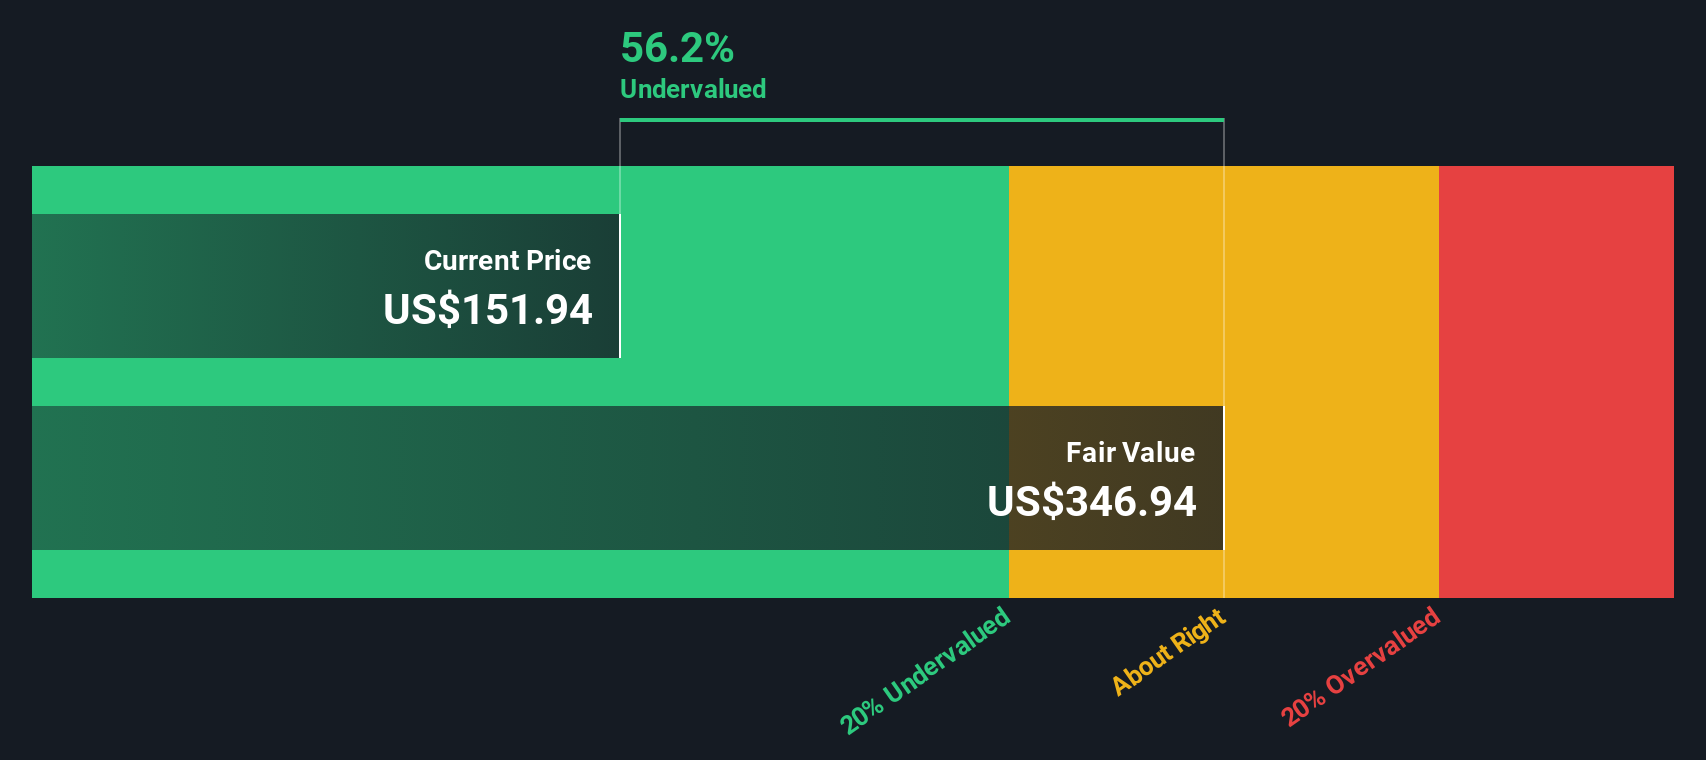
When all these projected cash flows are discounted back to today, Simply Wall St estimates an intrinsic value of about $335 per share, compared with a recent market price around $146. That implies Chevron is trading at roughly a 56.2% discount to its modeled fair value, suggesting investors are heavily discounting long term cash generation or building in a wide safety margin.
Result: UNDERVALUED
Our Discounted Cash Flow (DCF) analysis suggests Chevron is undervalued by 56.2%. Track this in your watchlist or portfolio, or discover 910 more undervalued stocks based on cash flows.
Approach 2: Chevron Price vs Earnings
For established, profitable businesses like Chevron, the Price to Earnings, or P E, ratio is a straightforward way to gauge whether investors are paying a reasonable price for each dollar of current earnings. It captures both what the company is earning today and how optimistic or cautious the market is about those earnings continuing.
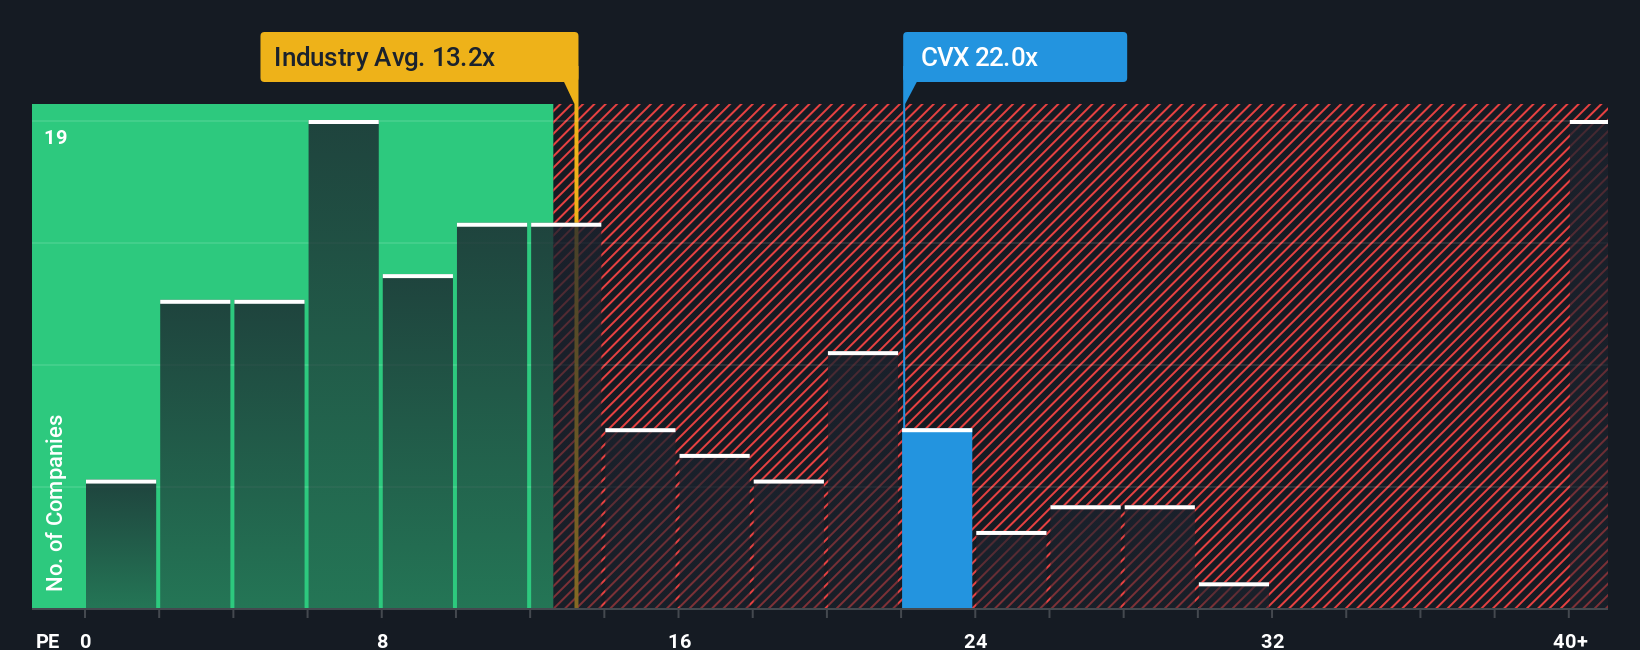
In general, companies with stronger, more reliable growth and lower perceived risk tend to justify a higher P E multiple, while slower growth or higher uncertainty usually calls for a lower one. Chevron currently trades on about 23.1x earnings, which is above the Oil and Gas industry average of roughly 12.8x and slightly richer than the 21.3x average of its large cap peers. On the surface, that might suggest Chevron is fully valued or even a bit expensive relative to the sector.
Simply Wall St uses a proprietary Fair Ratio to refine this view. This metric estimates what P E multiple Chevron should trade on, given its earnings growth outlook, industry, profit margins, market cap and company specific risks. Because it blends these fundamentals rather than relying purely on comparison, it tends to be a more targeted yardstick than simple peer or industry averages. For Chevron, the Fair Ratio is about 25.2x, modestly above the current 23.1x. That points to the market applying a small discount to what its fundamentals might justify, which may hint at a degree of undervaluation on an earnings basis.
Result: UNDERVALUED
PE ratios tell one story, but what if the real opportunity lies elsewhere? Discover 1463 companies where insiders are betting big on explosive growth.
Upgrade Your Decision Making: Choose your Chevron Narrative
Earlier we mentioned that there is an even better way to understand valuation. Let us introduce you to Narratives, a simple framework on Simply Wall St’s Community page that lets you write the story behind your numbers. You can link your view of Chevron’s future revenue, earnings and margins to a financial forecast, a Fair Value and clear buy or sell signals as that Fair Value is compared to today’s price. This is updated dynamically whenever new news or earnings arrive.
For example, one Chevron Narrative might lean bullish with a Fair Value near $197, assuming strong free cash flow from low cost production, successful integration of Hess and resilient demand. Another, more cautious Narrative might anchor closer to $124, stressing execution risks, slower energy transition progress and long term demand uncertainty. By seeing these perspectives side by side, you can quickly decide which story you believe, adjust the assumptions to match your own expectations and act with more confidence when the market price diverges from the Fair Value implied by your chosen Narrative.
Do you think there's more to the story for Chevron? Head over to our Community to see what others are saying!

This article by Simply Wall St is general in nature. We provide commentary based on historical data and analyst forecasts only using an unbiased methodology and our articles are not intended to be financial advice. It does not constitute a recommendation to buy or sell any stock, and does not take account of your objectives, or your financial situation. We aim to bring you long-term focused analysis driven by fundamental data. Note that our analysis may not factor in the latest price-sensitive company announcements or qualitative material. Simply Wall St has no position in any stocks mentioned.
Have feedback on this article? Concerned about the content? Get in touch with us directly. Alternatively, email editorial-team@simplywallst.com