
Does Rexford Industrial Realty’s Recent Share Performance Offer a Long Term Opportunity in 2025?
- If you are wondering whether Rexford Industrial Realty is quietly becoming a value opportunity or just fairly priced industrial real estate, you are in the right place.
- Rexford's share price now sits around $40.72, with returns of 2.7% over the last week, a modest 6.0% year to date, and 6.6% over the past year after a choppy 3 to 5 year stretch.
- Recently, the stock has been in focus as investors reassess demand for infill industrial properties in key coastal markets and the resilience of logistics driven real estate. At the same time, broader conversations about interest rates and capital costs have been driving sentiment across REITs, giving context to Rexford's more measured price moves.
- On our valuation framework, Rexford scores 3 out of 6 checks for being undervalued, which suggests the market may only be half acknowledging its strengths. Next, we will break down what different valuation approaches are saying about the stock and then finish with a deeper way to think about Rexford's true long term value story.
Find out why Rexford Industrial Realty's 6.6% return over the last year is lagging behind its peers.
Approach 1: Rexford Industrial Realty Discounted Cash Flow (DCF) Analysis
The Discounted Cash Flow model estimates what Rexford Industrial Realty is worth by projecting its adjusted funds from operations into the future and discounting those $ cash flows back to today.
Rexford is currently generating about $543.2 Million in free cash flow, and analysts, along with Simply Wall St extrapolations, see this rising steadily over time. Projections suggest free cash flow could reach roughly $864.9 Million by 2035, reflecting moderate but consistent growth in the company’s cash generation as its portfolio and rents expand.
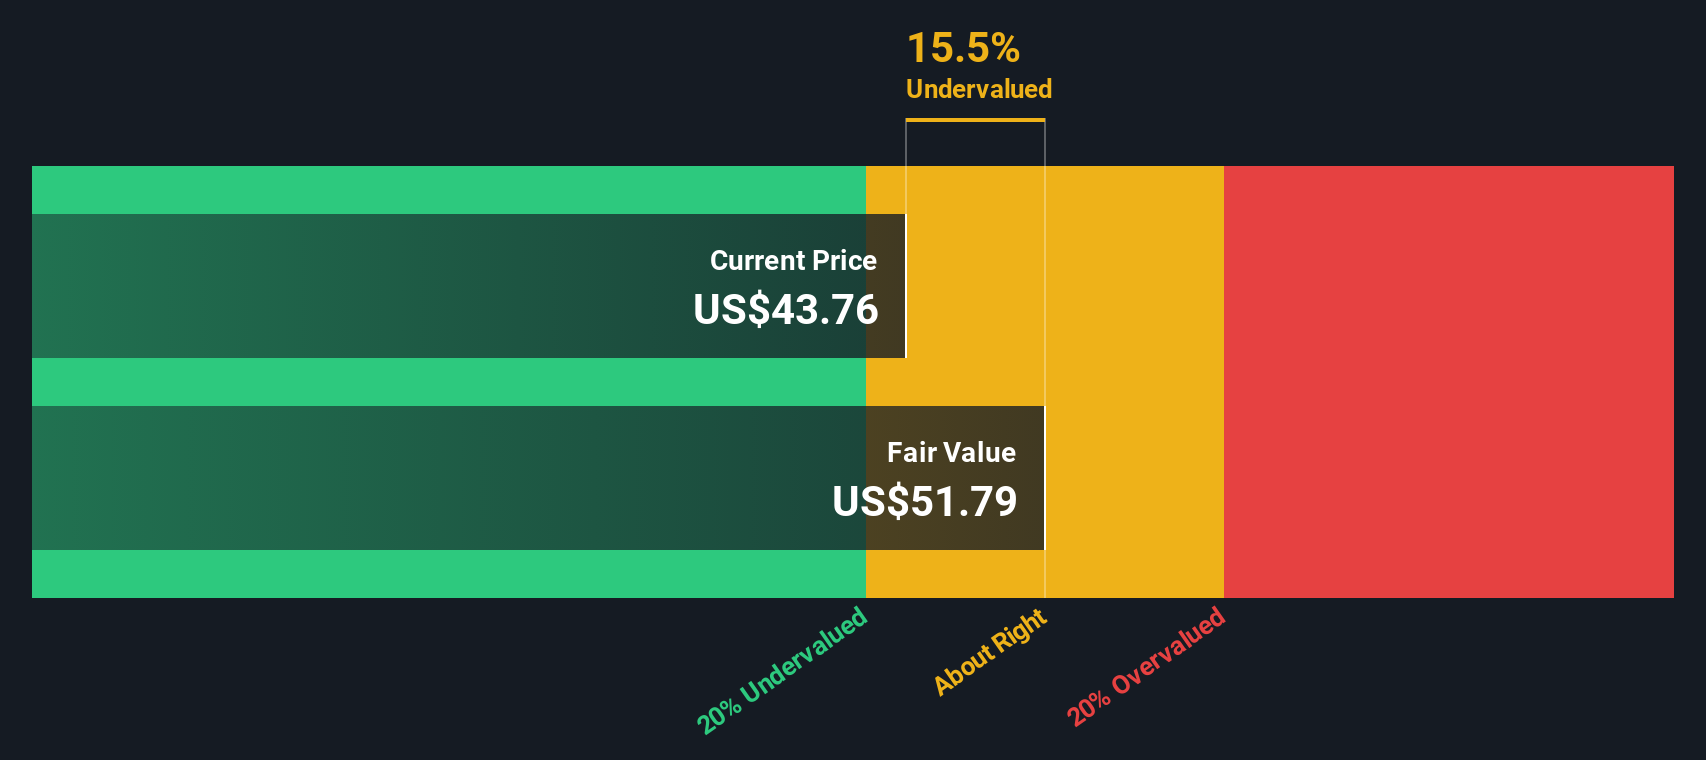
When all these future $ cash flows are discounted back using a 2 stage Free Cash Flow to Equity model, the intrinsic value for Rexford’s shares comes out at roughly $45.37 per share, compared to the current price of about $40.72. That implies the stock is around 10.3% undervalued on this DCF view, and suggests investors are not fully pricing in the long term cash flow potential of its infill industrial portfolio.
Result: UNDERVALUED
Our Discounted Cash Flow (DCF) analysis suggests Rexford Industrial Realty is undervalued by 10.3%. Track this in your watchlist or portfolio, or discover 912 more undervalued stocks based on cash flows.
Approach 2: Rexford Industrial Realty Price vs Earnings
For profitable companies like Rexford Industrial Realty, the price to earnings, or PE, ratio is a straightforward way to gauge how much investors are willing to pay today for each dollar of current earnings. A higher PE usually reflects stronger growth expectations or lower perceived risk, while a lower PE can signal slower growth, higher risk, or simply a bargain if the outlook is being underestimated.
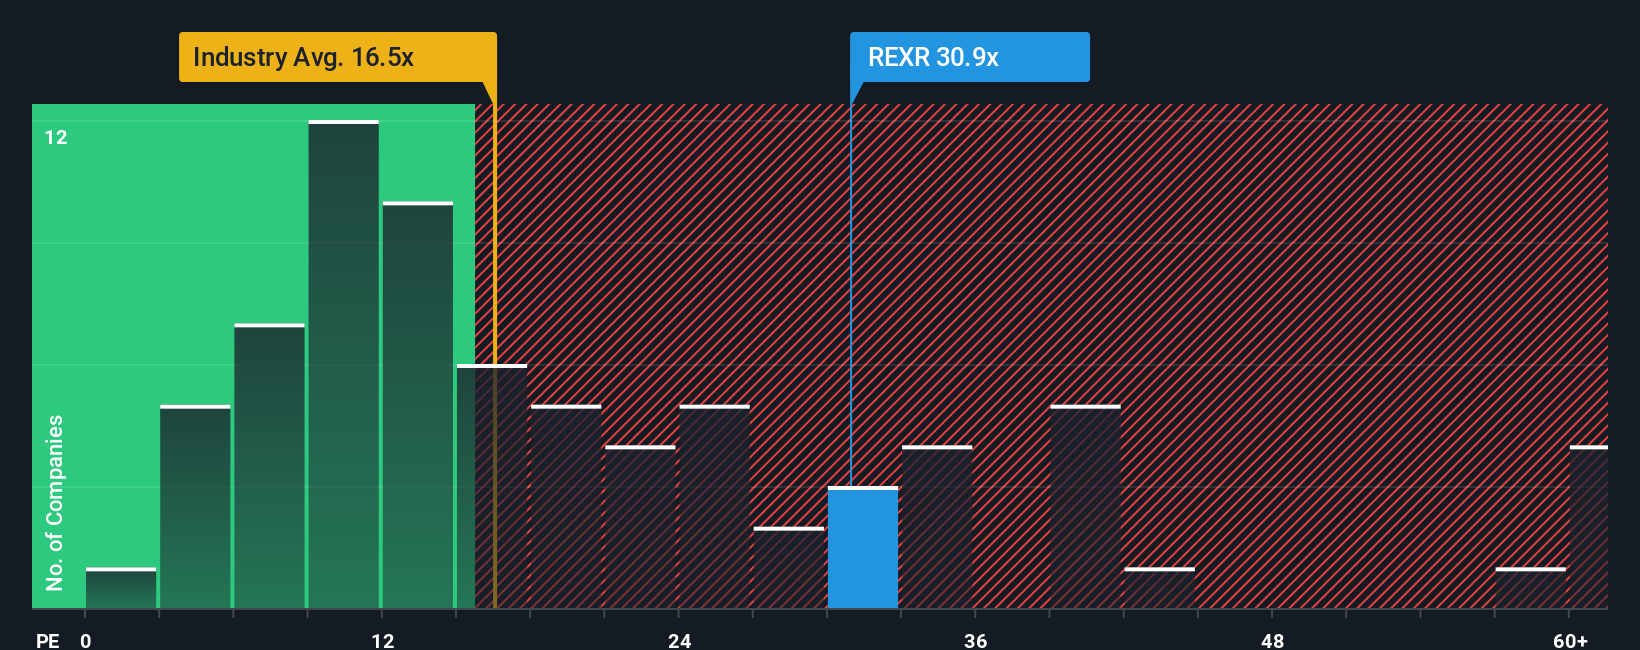
Rexford currently trades on a PE of about 28.8x. That is above the Industrial REITs sector average of roughly 16.3x, but slightly below the 29.9x average of its closer peer group. Simply Wall St also calculates a proprietary Fair Ratio of 29.8x for Rexford, which is the PE level you would expect given its earnings growth profile, margins, industry, size, and risk characteristics.
This Fair Ratio is more informative than a simple peer or sector comparison because it explicitly adjusts for Rexford’s own fundamentals rather than assuming all REITs deserve the same multiple. With the actual PE of 28.8x sitting just under the Fair Ratio of 29.8x, the stock appears modestly cheap relative to what its metrics justify.
Result: UNDERVALUED
PE ratios tell one story, but what if the real opportunity lies elsewhere? Discover 1462 companies where insiders are betting big on explosive growth.
Upgrade Your Decision Making: Choose your Rexford Industrial Realty Narrative
Earlier we mentioned that there is an even better way to understand valuation, so let us introduce you to Narratives, a simple but powerful way to connect your view of a company’s story with concrete forecasts for its future revenue, earnings and margins, and then translate that into your own fair value, all inside Simply Wall St’s Community page that millions of investors already use. For Rexford Industrial Realty, one Narrative might focus on Southern California scarcity, redevelopment upside and the new CEO’s capital allocation shift to justify a fair value closer to the most bullish analyst target around $44. A more cautious Narrative might lean into risks around rent pressure, redevelopment downtime and geographic concentration to support something nearer the most bearish $35 target. As news, earnings and guidance change, these Narratives automatically update their forecasts and fair value so you can continuously compare Fair Value to the latest Market Price and decide whether Rexford looks like a buy, hold or sell according to the story you actually believe.
Do you think there's more to the story for Rexford Industrial Realty? Head over to our Community to see what others are saying!

This article by Simply Wall St is general in nature. We provide commentary based on historical data and analyst forecasts only using an unbiased methodology and our articles are not intended to be financial advice. It does not constitute a recommendation to buy or sell any stock, and does not take account of your objectives, or your financial situation. We aim to bring you long-term focused analysis driven by fundamental data. Note that our analysis may not factor in the latest price-sensitive company announcements or qualitative material. Simply Wall St has no position in any stocks mentioned.
Have feedback on this article? Concerned about the content? Get in touch with us directly. Alternatively, email editorial-team@simplywallst.com