
ABM Industries (ABM) Margin Compression to 1.3% Fuels Bearish Narrative on Earnings Quality
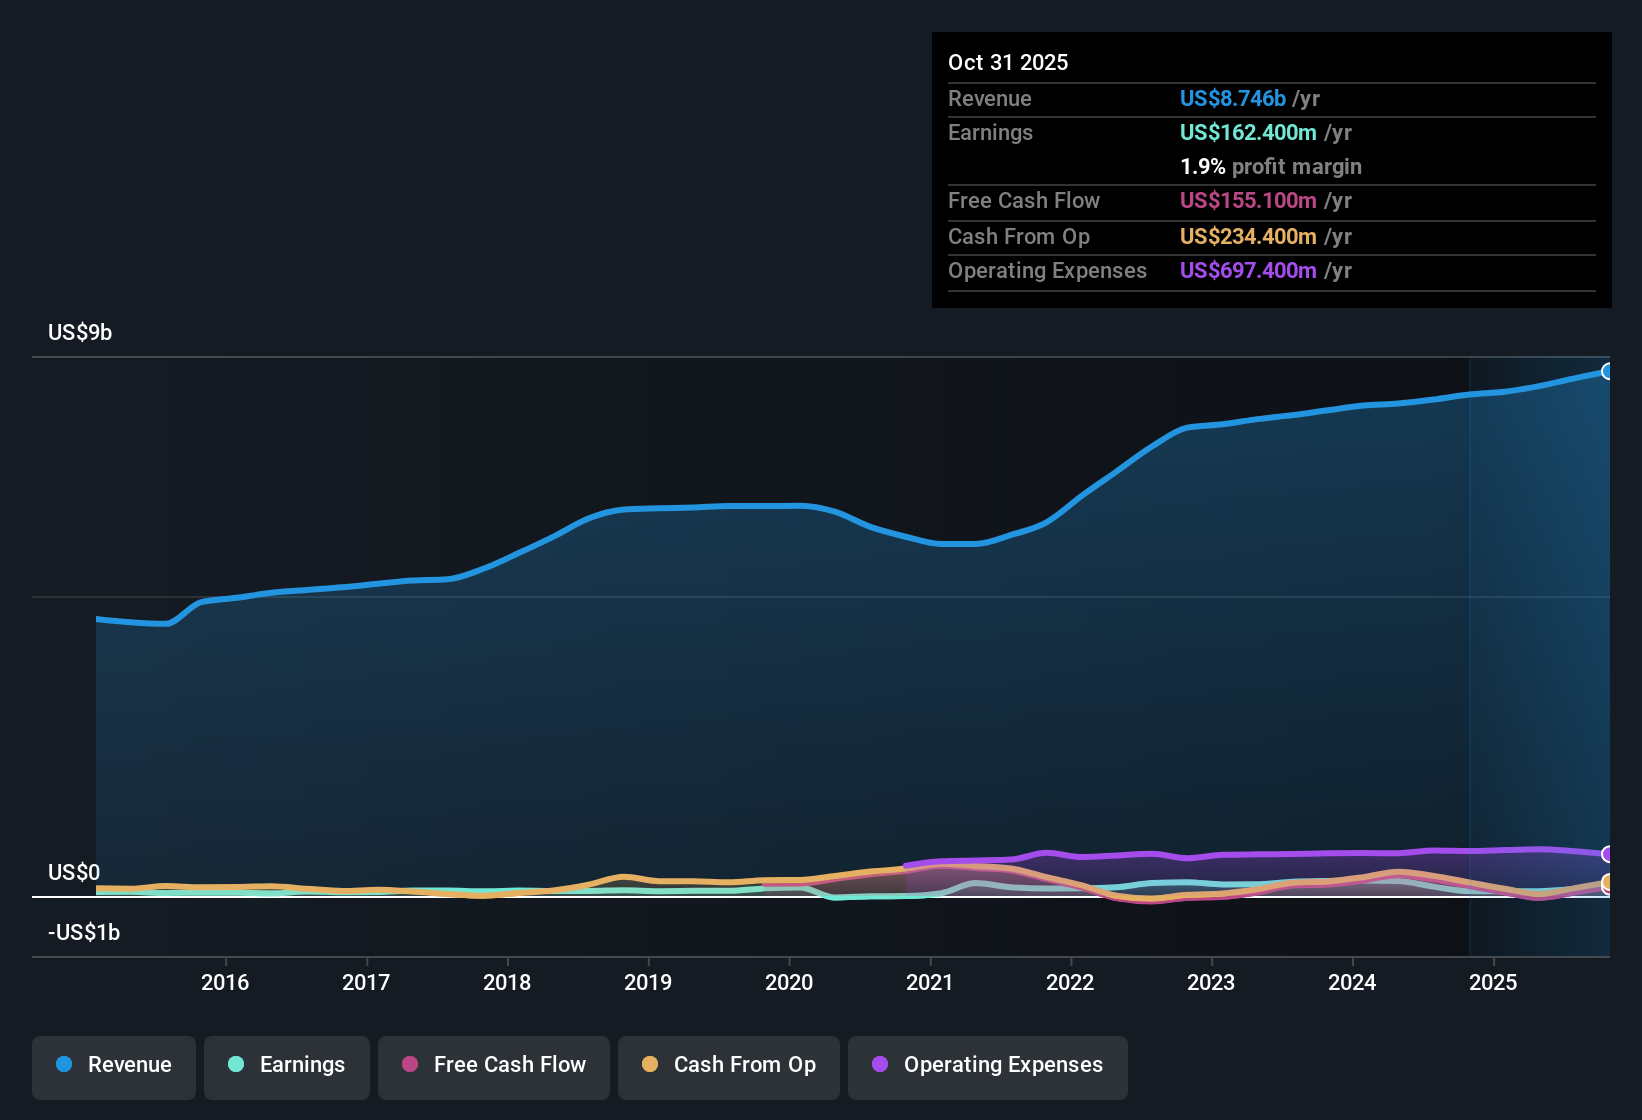
ABM Industries (ABM) has just posted its FY 2025 third quarter results with revenue of about $2.2 billion and EPS of $0.67, setting the tone for a year where margins and one off items are firmly in focus for investors. Over the past few quarters, the company has seen revenue move from $2.02 billion in Q2 FY 2024 to $2.11 billion in Q2 FY 2025 and then to $2.22 billion in Q3 FY 2025, while quarterly EPS has tracked in a tight band between roughly $0.67 and $0.70, pointing to stable profitability on an underlying basis even as net profit margins have recently sat near 1.3%.
See our full analysis for ABM Industries.With the headline numbers on the table, the next step is to line these results up against the key narratives around ABM to see which stories the latest margins support and which ones the data starts to push back on.
See what the community is saying about ABM Industries
Margins Slip as Net Profit Shares Shrink to 1.3%
- Over the last 12 months, ABM converted $8.6 billion of revenue into $115.9 million of net income, which works out to a 1.3% net margin compared with 1.9% a year earlier.
- Bears focus on this thinner margin, arguing that ongoing pricing concessions and lower margin contracts could lock ABM into weaker profitability, yet
- the company has still managed around 4.4% average annual earnings growth over the past five years, showing it can grow over time even with near term pressure, and
- the $95.7 million one off loss in the last 12 months means part of the recent margin compression reflects a specific charge rather than everyday operations.
Top Line Keeps Climbing While EPS Stays Tight
- Revenue has stepped up from $2.02 billion in Q2 FY 2024 to $2.22 billion in Q3 FY 2025, while quarterly EPS has stayed in a narrow band around $0.67 to $0.70, and trailing 12 month EPS now sits at about $1.85.
- Consensus narrative highlights steady demand for facility services and new contract wins as drivers for future growth, and this steady EPS range alongside rising revenue
- supports the idea that ABM is holding profitability roughly steady for now even as it grows sales in areas like prime commercial properties and technical solutions, and
- shows that despite segment margin headwinds mentioned in the narrative, the overall earnings profile has not swung wildly quarter to quarter since the unusual losses in FY 2024.
Valuation Signals Big Gap to DCF Fair Value
- At a share price of $48.25 and a P/E of 25.5 times, ABM trades below its peer average of 47.7 times but above the US Commercial Services industry at 23.8 times, while our data show a DCF fair value of about $153.01 per share and an analyst price target of $57.00.
- Bulls lean on this discount, arguing that if earnings grow toward the $370.4 million that analysts expect by around 2028,
- today's price, which is roughly two thirds below the DCF fair value figure, offers upside if margins recover from 1.3% toward the 3.9% margin analysts model, and
- the current P/E leaves room for re rating if ABM can translate its revenue base of more than $8.6 billion into higher quality, more cash generative earnings over the next few years.
Next Steps
To see how these results tie into long-term growth, risks, and valuation, check out the full range of community narratives for ABM Industries on Simply Wall St. Add the company to your watchlist or portfolio so you'll be alerted when the story evolves.
See the numbers differently? In just a few minutes, you can turn that view into a full narrative that reflects your own outlook: Do it your way.
A great starting point for your ABM Industries research is our analysis highlighting 1 key reward and 3 important warning signs that could impact your investment decision.
See What Else Is Out There
ABM's thin 1.3% net margin, recent one off loss, and reliance on a future margin recovery show its earnings quality and resilience are still uncertain.
If you want steadier performers instead of hoping for a turnaround, use our stable growth stocks screener (2094 results) to focus on companies already compounding revenue and earnings reliably through different market conditions.
This article by Simply Wall St is general in nature. We provide commentary based on historical data and analyst forecasts only using an unbiased methodology and our articles are not intended to be financial advice. It does not constitute a recommendation to buy or sell any stock, and does not take account of your objectives, or your financial situation. We aim to bring you long-term focused analysis driven by fundamental data. Note that our analysis may not factor in the latest price-sensitive company announcements or qualitative material. Simply Wall St has no position in any stocks mentioned.
Have feedback on this article? Concerned about the content? Get in touch with us directly. Alternatively, email editorial-team@simplywallst.com