
Does Constellation Brands’ 37% Slide Create an Opportunity for Investors in 2025?
- If you are wondering whether Constellation Brands is finally cheap enough to consider or still a value trap in disguise, this breakdown will help you assess whether the current price matches the business behind the ticker.
- The stock has fallen 37.2% over the past year and is down 36.7% over three years, even after a recent 6.7% bounce in the last 30 days that has some investors asking if the selling has gone too far.
- Recent headlines have focused on shifting consumer demand in the premium beer and spirits categories and how Constellation is reshaping its portfolio to stay ahead of those trends. At the same time, the market has been reassessing alcohol names more broadly as investors weigh growth prospects against inflation, pricing power, and changing consumer preferences.
- Right now, Constellation Brands scores a 3/6 valuation score based on our core checks, suggesting pockets of undervaluation alongside some justified market caution. We will unpack what that means across different valuation methods, then close with a more complete way to think about what the stock may be worth.
Find out why Constellation Brands's -37.2% return over the last year is lagging behind its peers.
Approach 1: Constellation Brands Discounted Cash Flow (DCF) Analysis
A Discounted Cash Flow (DCF) model estimates what a business is worth today by projecting the cash it can generate in the future and then discounting those cash flows back to their value in todays dollars.
For Constellation Brands, the latest twelve month free cash flow is about $1.63 billion. Analysts supply detailed forecasts for the next few years, and Simply Wall St then extends those trends, resulting in projected free cash flow of roughly $2.81 billion by 2035. That path includes specific analyst estimates out to 2030, where free cash flow is expected to be around $2.48 billion, with later years extrapolated at modest growth rates.
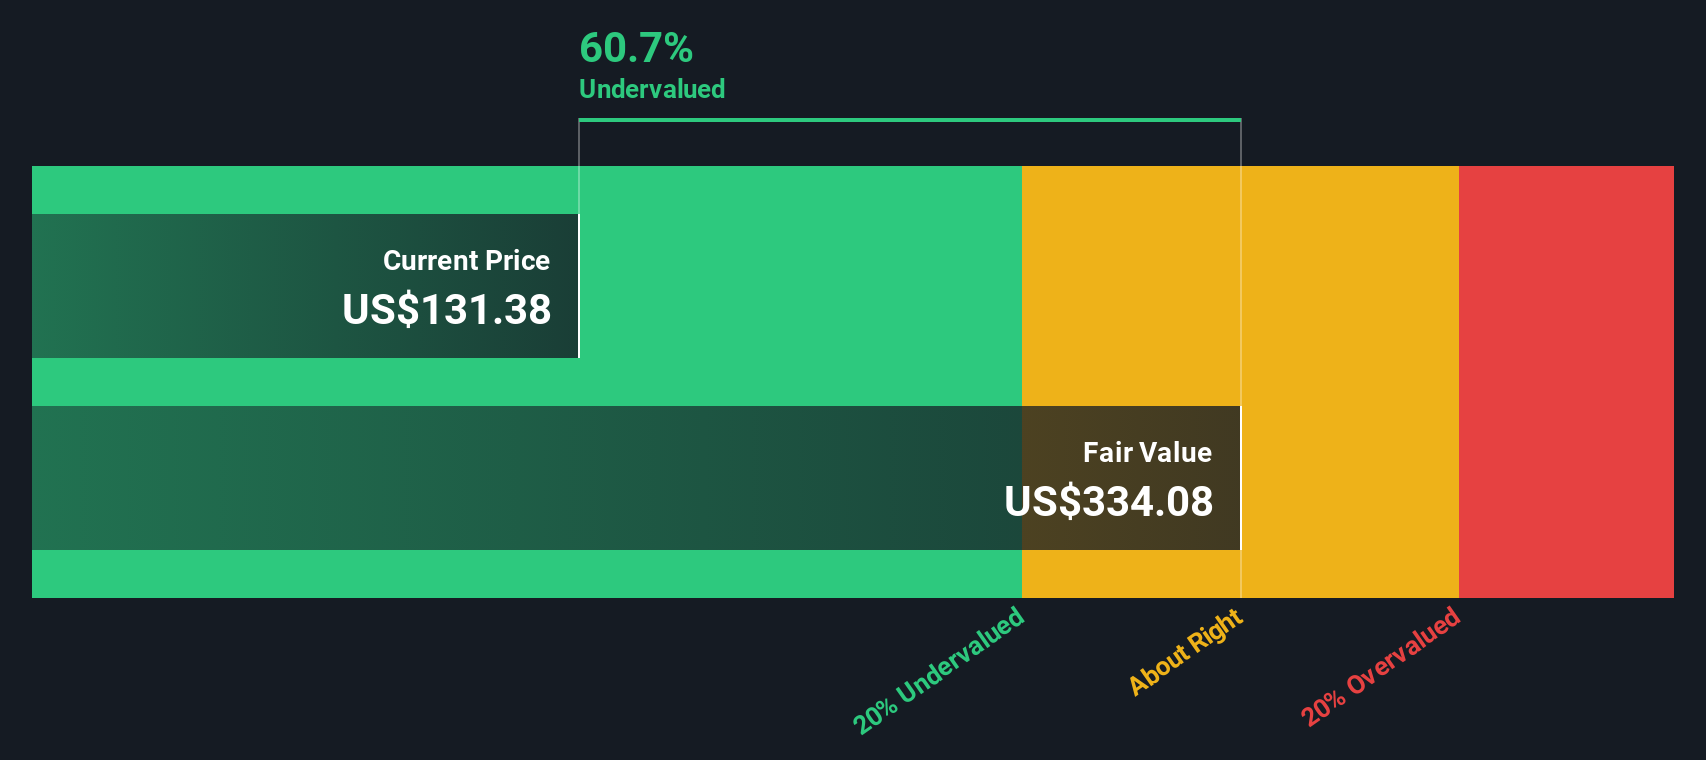
Using a 2 Stage Free Cash Flow to Equity model on these projections gives an estimated intrinsic value of about $325.72 per share. Compared with the current market price, this implies the stock trades at a 57.1% discount to its calculated fair value. This suggests investors are pricing in a lot of pessimism relative to the cash flows the business is expected to generate.
Result: UNDERVALUED
Our Discounted Cash Flow (DCF) analysis suggests Constellation Brands is undervalued by 57.1%. Track this in your watchlist or portfolio, or discover 912 more undervalued stocks based on cash flows.
Approach 2: Constellation Brands Price vs Earnings
For a profitable, established business like Constellation Brands, the price to earnings (PE) ratio is a useful way to see how much investors are willing to pay for each dollar of current earnings. It captures expectations for future growth and the perceived risk of those earnings continuing. Generally, faster growing and lower risk companies justify higher PE ratios, while slower or more uncertain names tend to trade on lower multiples.
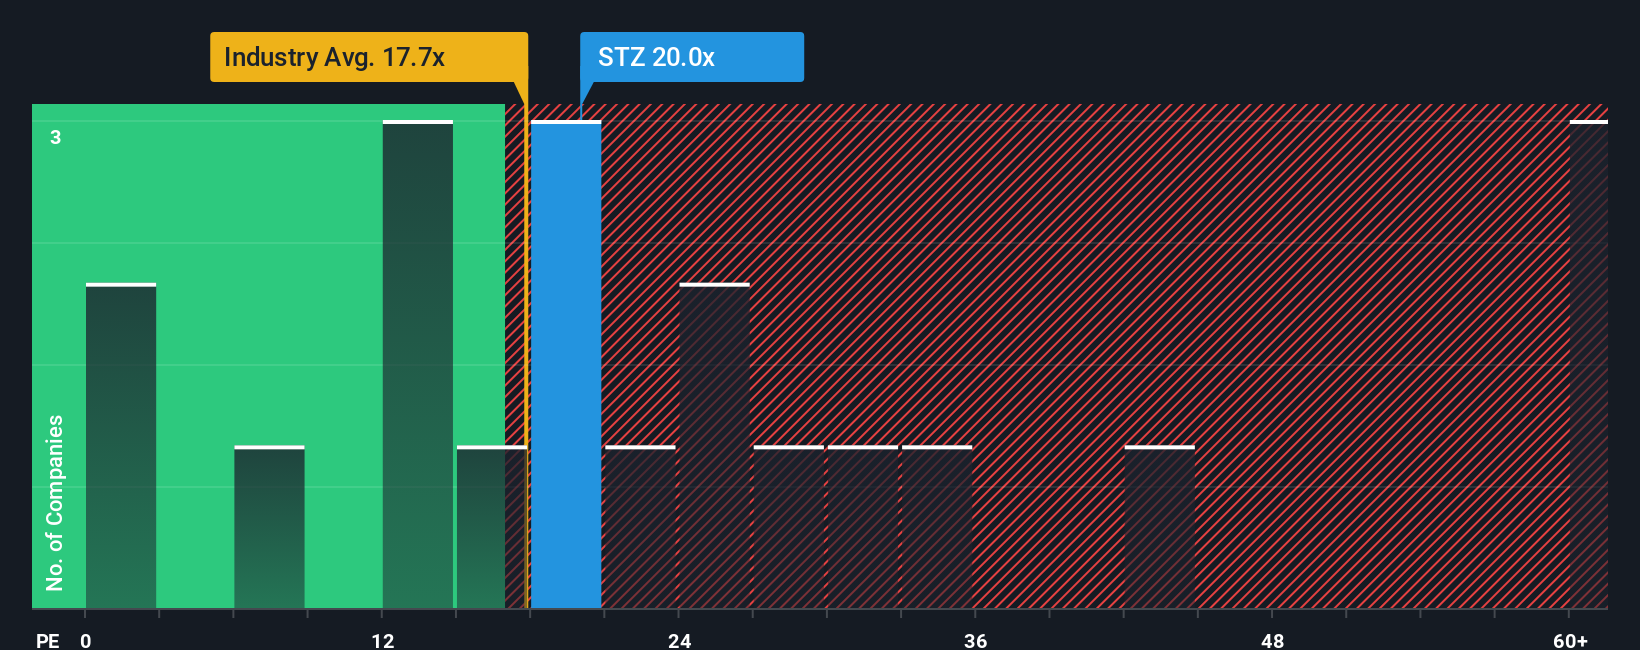
Constellation currently trades at about 19.9x earnings, slightly above the broader Beverage industry average of roughly 17.4x and near its direct peer group average of around 19.5x. On the surface, that suggests the stock is being valued in line with comparable alcohol names, with a modest premium to the industry as a whole.
Simply Wall St refines this approach with a proprietary Fair Ratio of 21.8x for Constellation. This estimates the PE the company should trade on, given its earnings growth outlook, margins, industry position, market cap, and risk profile. This stock specific lens is more informative than simple peer or sector comparisons, because it adjusts for quality and growth instead of assuming all Beverage companies deserve the same multiple. With the market multiple of 19.9x sitting below the 21.8x Fair Ratio, the PE perspective points to Constellation Brands being modestly undervalued.
Result: UNDERVALUED
PE ratios tell one story, but what if the real opportunity lies elsewhere? Discover 1462 companies where insiders are betting big on explosive growth.
Upgrade Your Decision Making: Choose your Constellation Brands Narrative
Earlier we mentioned that there is an even better way to understand valuation, so let's introduce you to Narratives. This is a simple way to put your story about Constellation Brands into numbers by linking what you believe about its brands, competitive position, and risks to a financial forecast for revenue, earnings, and margins, and then to a clear Fair Value estimate that you can easily compare with the current share price to decide whether it looks like a buy, hold, or sell today.
On Simply Wall St, Narratives live inside the Community page. They are used by millions of investors as an accessible, visual tool that automatically refreshes when new information, such as earnings or major news, comes in so your thesis and Fair Value stay aligned with reality rather than going stale on a spreadsheet somewhere.
For example, one Constellation Brands Narrative might lean toward the higher end of community Fair Values, assuming beer demand recovers, margins expand toward the low 20s, and the market awards a mid teens PE multiple. A more cautious Narrative might anchor closer to the lowest community Fair Values, baking in slower top line growth, persistent cost pressures from tariffs and inflation, and a lower terminal multiple. The spread between optimistic and pessimistic Narratives shows you exactly which assumptions need to be true before you act on the price you see on screen.
Do you think there's more to the story for Constellation Brands? Head over to our Community to see what others are saying!

This article by Simply Wall St is general in nature. We provide commentary based on historical data and analyst forecasts only using an unbiased methodology and our articles are not intended to be financial advice. It does not constitute a recommendation to buy or sell any stock, and does not take account of your objectives, or your financial situation. We aim to bring you long-term focused analysis driven by fundamental data. Note that our analysis may not factor in the latest price-sensitive company announcements or qualitative material. Simply Wall St has no position in any stocks mentioned.
Have feedback on this article? Concerned about the content? Get in touch with us directly. Alternatively, email editorial-team@simplywallst.com