
Is It Too Late To Consider Applied Materials After Its Strong 2025 Share Price Surge?
- If you are wondering whether Applied Materials is still worth considering after a strong run, or if you are late to the party, you are in the right place to unpack what the current price is really telling us.
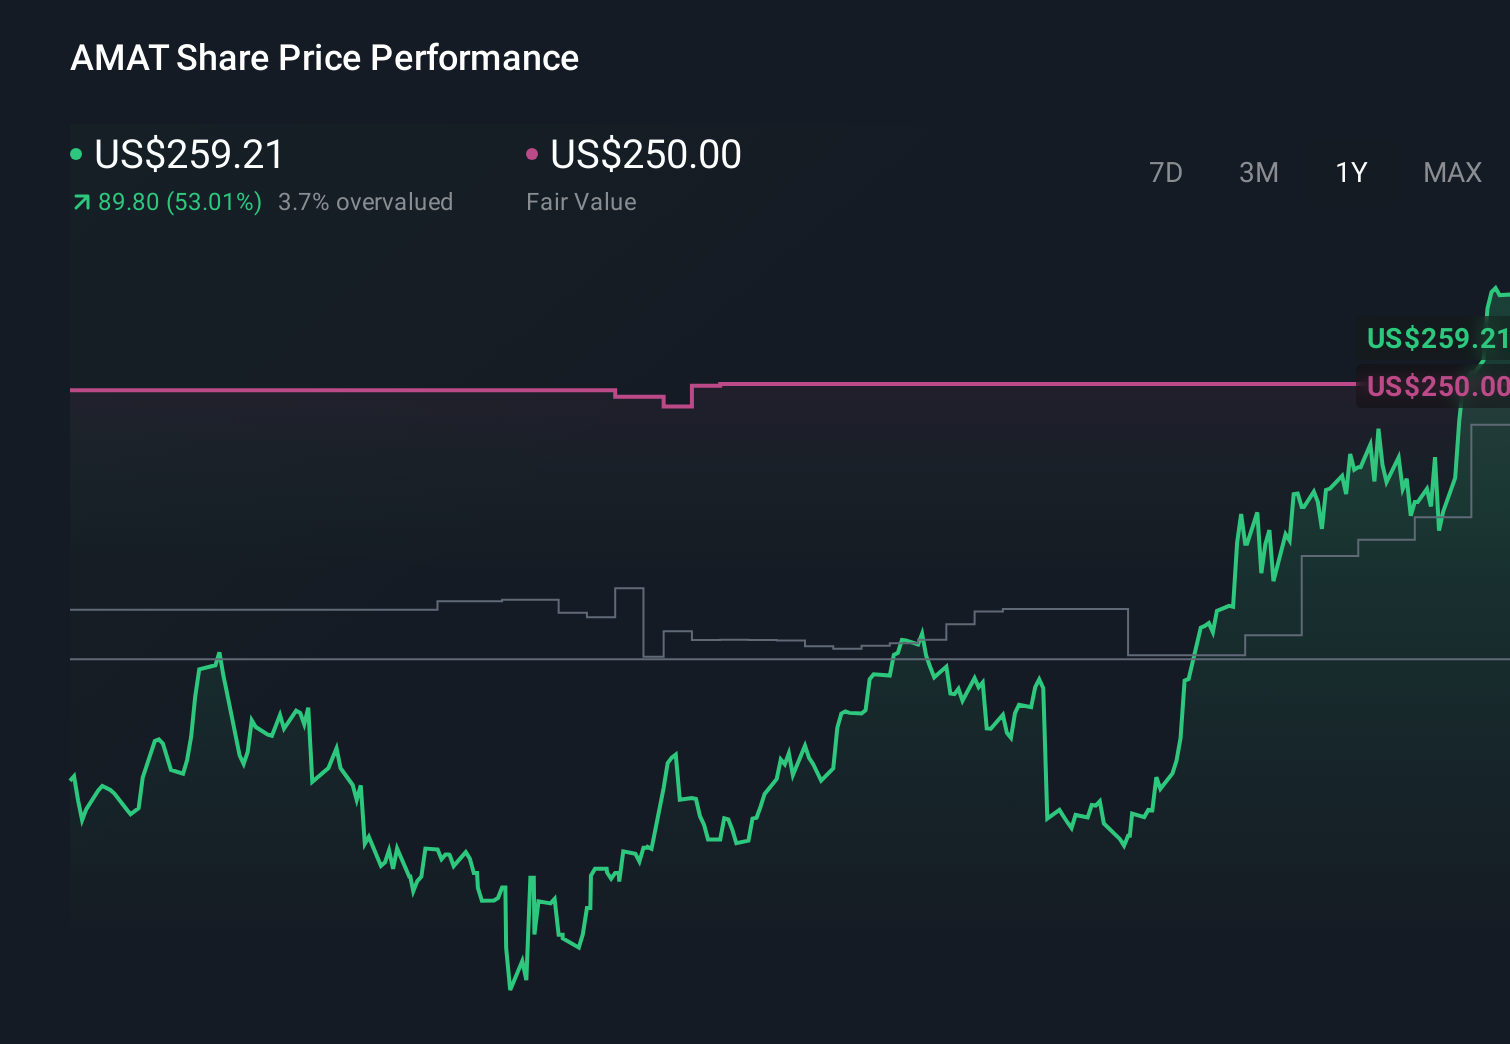
- Despite some recent volatility, with the stock down 9.8% over the last week, it is still up 8.6% over 30 days and 51.5% year to date, compounding to 51.6% over 1 year, 140.8% over 3 years and 208.5% over 5 years.
- Those swings are happening against a backdrop of ongoing AI and chip capacity investment, where Applied Materials continues to play key roles in major fab expansions and process technology upgrades. Investors are effectively betting that the company will remain a critical picks and shovels supplier to the semiconductor and AI infrastructure build-out.
- On our valuation framework, Applied Materials scores a 3 out of 6, suggesting it appears undervalued on some checks but not others. Next, we will walk through those different valuation approaches before finishing with a more powerful way to think about what the market is really pricing in.
Approach 1: Applied Materials Discounted Cash Flow (DCF) Analysis
A Discounted Cash Flow model estimates what a company is worth by projecting the cash it can generate in the future and then discounting those cash flows back to today in $ terms. For Applied Materials, the 2 Stage Free Cash Flow to Equity model starts with last twelve months free cash flow of about $6.38 billion and then applies analyst forecasts and longer term growth assumptions.
Analysts expect free cash flow to rise steadily over the next decade, reaching around $10.27 billion by 2030, with growth gradually slowing as the business matures. Beyond the first five years or so, Simply Wall St extends these projections using more conservative growth rates to avoid over extrapolating the current AI driven upcycle.
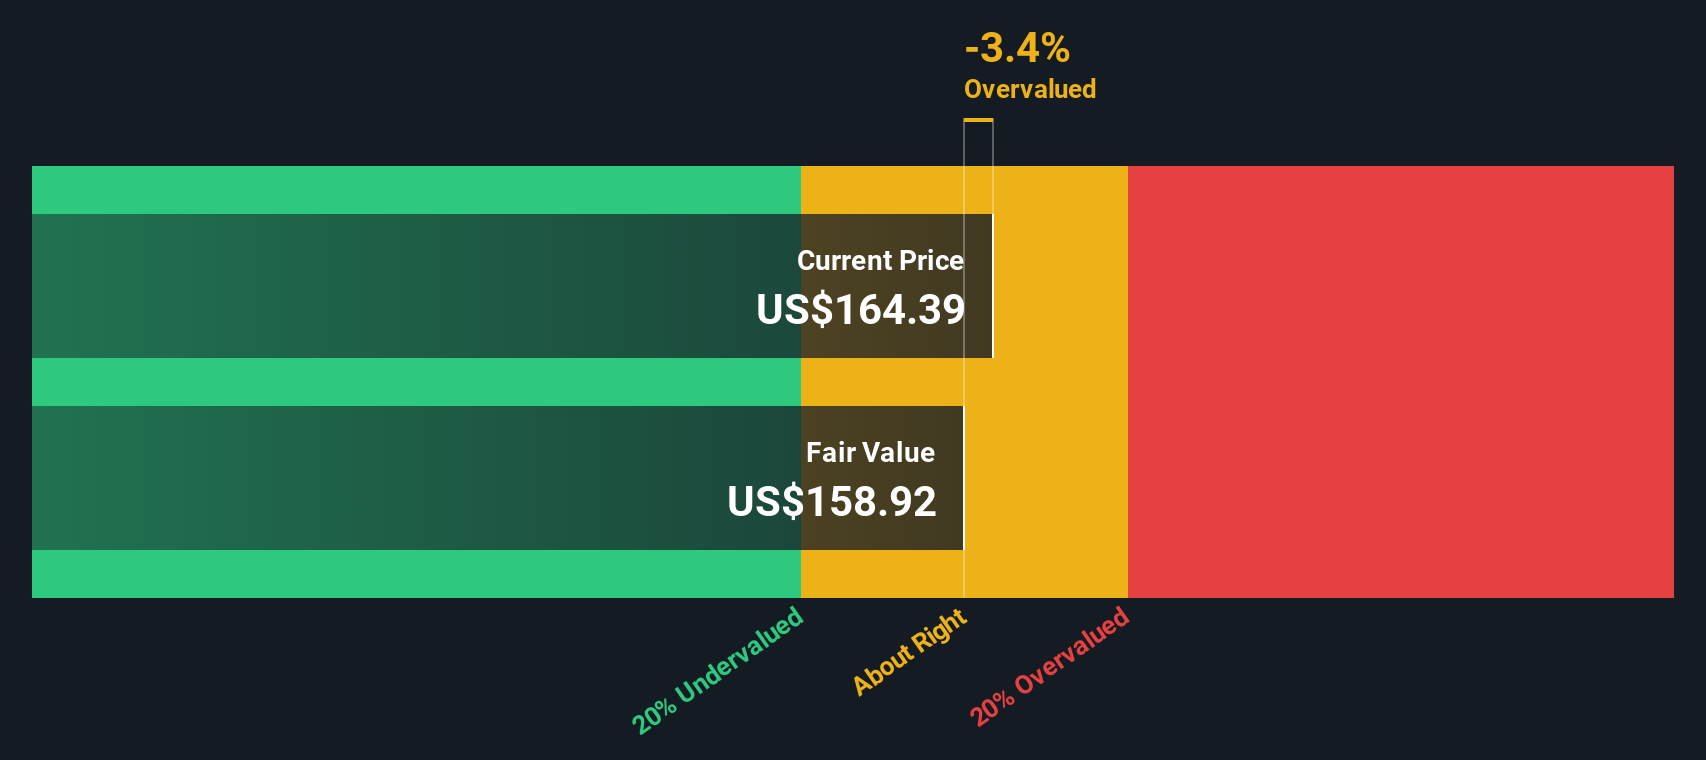
Putting all of those projected cash flows together and discounting them back to today produces an estimated intrinsic value of $156.75 per share. Compared with the current share price, the DCF implies the stock is about 58.4% overvalued, which indicates that a lot of future growth is already reflected in the price.
Result: OVERVALUED
Our Discounted Cash Flow (DCF) analysis suggests Applied Materials may be overvalued by 58.4%. Discover 912 undervalued stocks or create your own screener to find better value opportunities.
Approach 2: Applied Materials Price vs Earnings
For profitable companies like Applied Materials, the price to earnings (PE) ratio is a useful way to gauge whether investors are paying a reasonable price for each dollar of current earnings. A higher PE can be justified when a company is expected to grow faster or is seen as lower risk, while slower growing or riskier businesses typically deserve a lower, more conservative PE.
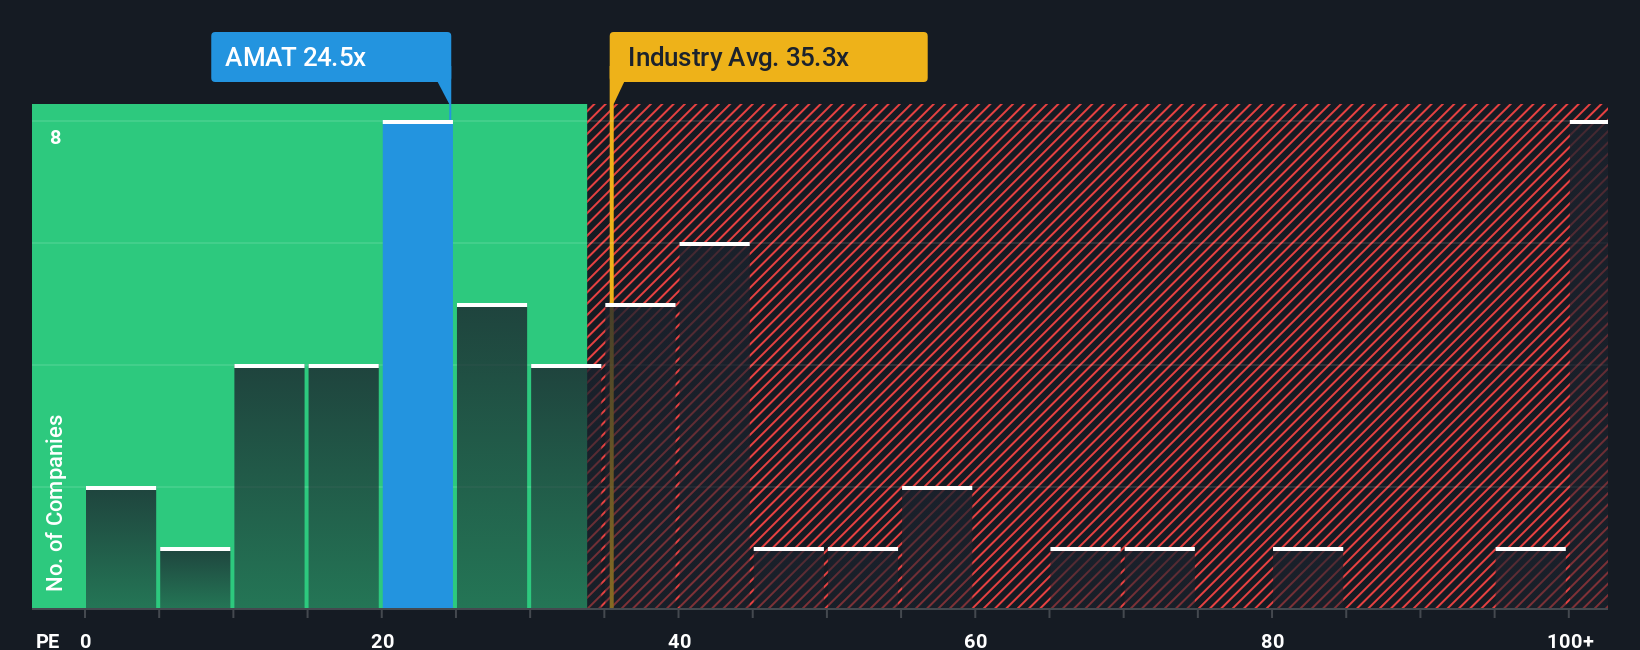
Applied Materials currently trades on a PE of about 28.1x, which is below both the semiconductor industry average of roughly 36.8x and the peer group average of around 40.6x. On the surface that might suggest the stock is inexpensive relative to its sector and closest comparables.
However, Simply Wall St also uses a proprietary Fair Ratio of 29.8x. This estimates what a reasonable PE should be after factoring in Applied Materials earnings growth outlook, profitability, industry positioning, market cap and risk profile. This tailored Fair Ratio is more informative than a simple comparison to peers or the broad industry because it is calibrated to the company specific fundamentals that actually drive long term returns. Since the Fair Ratio of 29.8x is only slightly above the current 28.1x, the shares look modestly undervalued on this metric.
Result: UNDERVALUED
PE ratios tell one story, but what if the real opportunity lies elsewhere? Discover 1462 companies where insiders are betting big on explosive growth.
Upgrade Your Decision Making: Choose your Applied Materials Narrative
Earlier we mentioned that there is an even better way to understand valuation, so let us introduce you to Narratives, a simple framework on Simply Wall St’s Community page where you connect your view of Applied Materials business story with your assumptions for future revenue, earnings and margins. These then flow into a financial forecast, a Fair Value estimate, and ultimately a clear buy or sell signal by comparing that Fair Value to today’s share price. The powerful twist is that these Narratives update dynamically as new news, earnings and guidance come in. You might see one investor building a more conservative Applied Materials Narrative that assumes slower revenue growth and a Fair Value closer to about $194 per share, while another investor, focused on a stronger AI and equipment upcycle, assumes faster growth, higher margins and a Fair Value nearer $248. This allows both to act consistently with their own conviction while using the same structured, accessible tool.
For Applied Materials however, here are previews of two leading Applied Materials Narratives:
Fair value: $248.44
Implied undervaluation vs last close: -0.1%
Revenue growth assumption: 5.92%
- Sees Applied Materials as a prime long term beneficiary of AI driven demand, advanced packaging and over 100 new or expanded fabs globally, supported by government incentives.
- Emphasizes rising high margin recurring revenue from services and spares, plus deep customer co innovation at major technology inflections, as foundations for more resilient margins and earnings growth.
- Flags China exposure, customer concentration and execution risks, but ultimately concludes that improving analyst confidence and moderating policy fears are used to support a fair value above $240 per share.
Fair value: $194.11
Implied overvaluation vs last close: 27.94%
Revenue growth assumption: 7%
- Recognizes structural tailwinds from AI, cloud, EVs and global fab build outs, but argues that much of this growth story is already embedded in today’s share price.
- Highlights headwinds from China trade restrictions, industry cyclicality, supply chain and geopolitical risks that could disrupt demand and compress valuation multiples.
- Suggests that with fair value around $194, some investors may see reason for caution about buying after a strong run, especially if AI driven capex or export policy trends disappoint.
Do you think there's more to the story for Applied Materials? Head over to our Community to see what others are saying!
This article by Simply Wall St is general in nature. We provide commentary based on historical data and analyst forecasts only using an unbiased methodology and our articles are not intended to be financial advice. It does not constitute a recommendation to buy or sell any stock, and does not take account of your objectives, or your financial situation. We aim to bring you long-term focused analysis driven by fundamental data. Note that our analysis may not factor in the latest price-sensitive company announcements or qualitative material. Simply Wall St has no position in any stocks mentioned.
Have feedback on this article? Concerned about the content? Get in touch with us directly. Alternatively, email editorial-team@simplywallst.com