
Does SharkNinja’s Recent 33.5% Rally Still Leave Room for Long Term Upside?
- Wondering if SharkNinja is still a smart buy after its big run, or if the price has already baked in the growth story? In this article, we unpack what the current share price is really saying about future expectations.
- SharkNinja has been on a strong short term rally, with the stock up 33.5% over the last month and 16.5% year to date, even though it dipped slightly by 0.2% in the last week.
- Part of this momentum has come as investors react to SharkNinja's expanding product lineup in home appliances and cleaning, and growing shelf space with major US and international retailers. The market is also paying attention to its push into premium categories, which could support higher margins if demand holds up.
- Right now, SharkNinja scores a 2 out of 6 on our valuation checks. This suggests pockets of undervaluation but also areas where the price looks full. In the rest of this article we break down what different valuation approaches say about the stock and then finish with a more holistic way to think about its true worth.
SharkNinja scores just 2/6 on our valuation checks. See what other red flags we found in the full valuation breakdown.
Approach 1: SharkNinja Discounted Cash Flow (DCF) Analysis
A Discounted Cash Flow model estimates what a company is worth today by projecting the cash it can generate in the future and discounting those cash flows back into today’s dollars.
For SharkNinja, the latest twelve month Free Cash Flow is about $373 million. Analysts and internal estimates expect this to climb steadily, with projections reaching around $1.74 billion in Free Cash Flow by 2035. The nearer term outlook is also strong, with forecast Free Cash Flow of roughly $731 million in 2026 and $1.2 billion by 2029, based on a mix of analyst estimates and extrapolations.
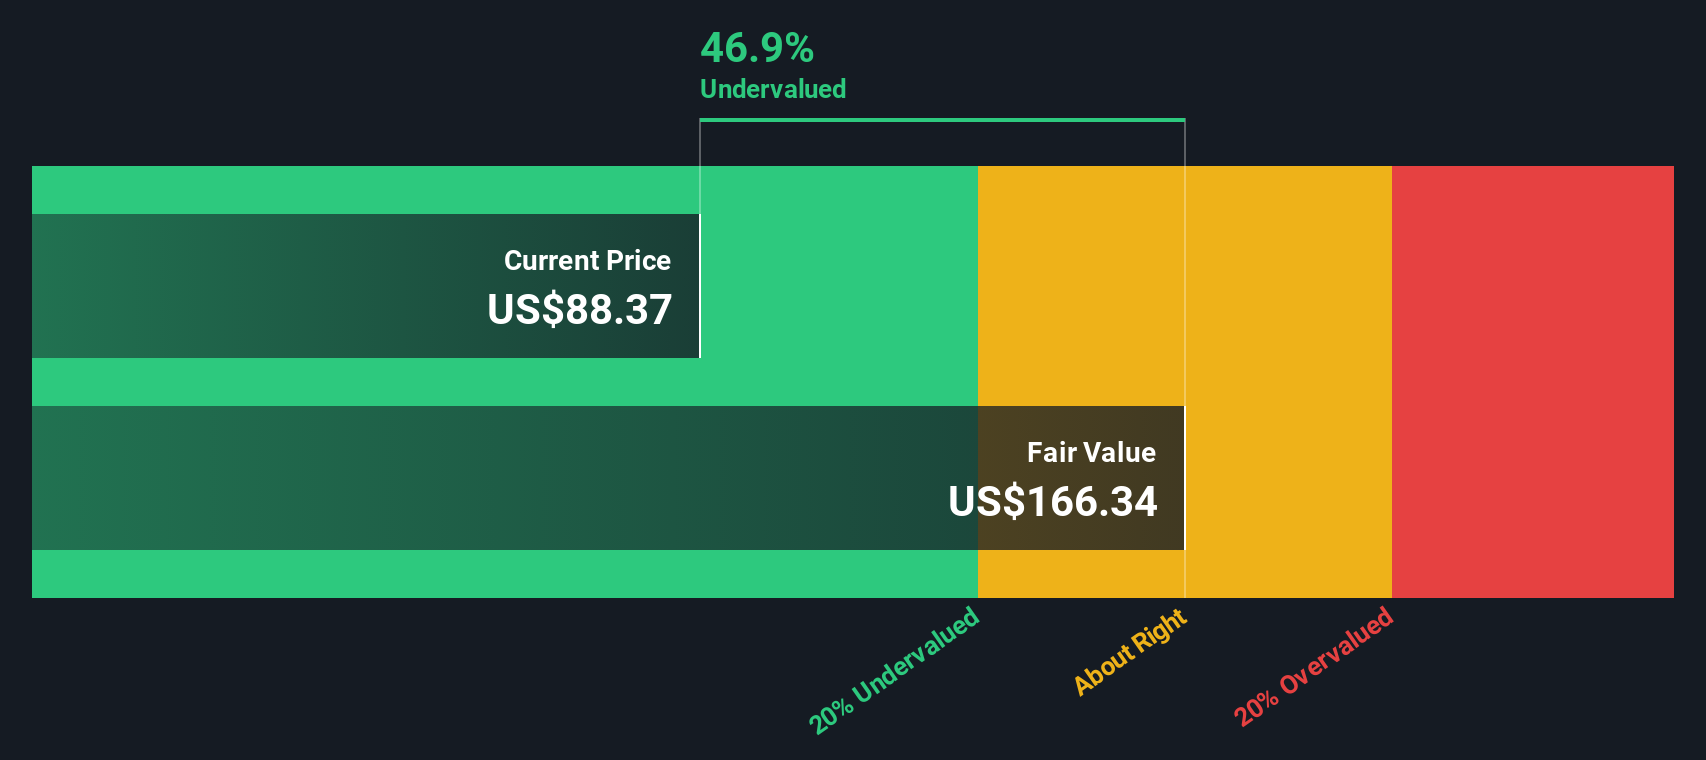
Using a 2 Stage Free Cash Flow to Equity model, these projected cash flows translate into an estimated intrinsic value of $163.13 per share. Compared with the current market price, this implies a 30.7% discount, indicating that investors may not be fully pricing in the expected cash generation.
Result: UNDERVALUED
Our Discounted Cash Flow (DCF) analysis suggests SharkNinja is undervalued by 30.7%. Track this in your watchlist or portfolio, or discover 911 more undervalued stocks based on cash flows.
Approach 2: SharkNinja Price vs Earnings
For profitable companies like SharkNinja, the Price to Earnings ratio is a useful way to gauge what investors are willing to pay for each dollar of current profit. In general, faster growth and lower risk justify a higher PE ratio, while slower growth or greater uncertainty usually mean a lower, more conservative multiple is appropriate.
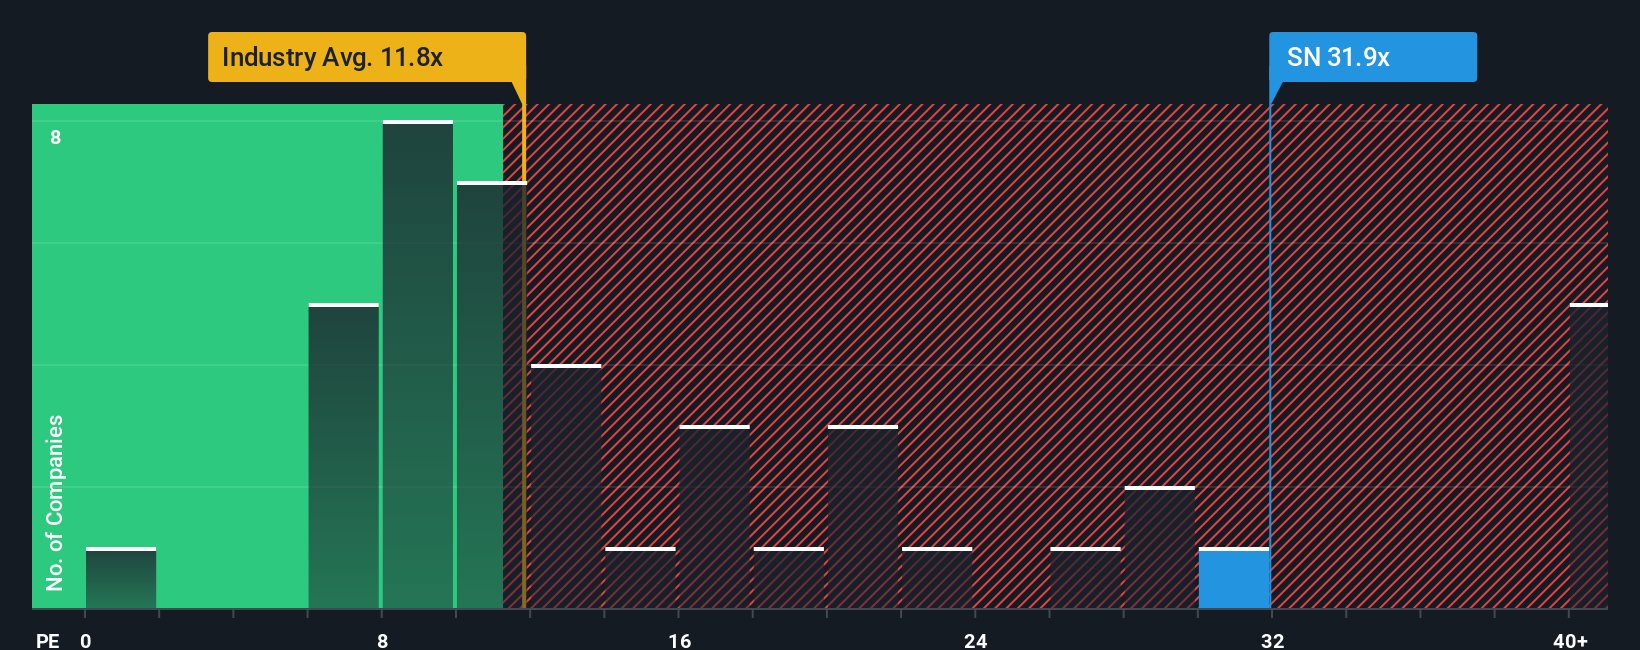
SharkNinja currently trades at about 27.8x earnings, which is well above the broader Consumer Durables industry average of around 10.7x and slightly above a peer group average near 25.8x. To move beyond simple comparisons, Simply Wall St calculates a proprietary Fair Ratio, which estimates what a reasonable PE should be given SharkNinja’s earnings growth profile, margins, industry, market cap and key risks.
This Fair Ratio for SharkNinja is 22.1x, suggesting that a typical investor might expect to pay closer to this multiple for the company’s fundamentals. Because the Fair Ratio incorporates growth, risk and profitability, it is more tailored than a basic peer or industry comparison. With the current PE at 27.8x, the stock screens as somewhat expensive relative to this Fair Ratio.
Result: OVERVALUED
PE ratios tell one story, but what if the real opportunity lies elsewhere? Discover 1463 companies where insiders are betting big on explosive growth.
Upgrade Your Decision Making: Choose your SharkNinja Narrative
Earlier we mentioned that there is an even better way to understand valuation, so let us introduce you to Narratives, a simple framework that lets you spell out your story for a company and then turn that story into numbers like future revenue, earnings, margins and a fair value estimate.
A Narrative links three things together: how you think the business will evolve, what that means for a realistic financial forecast, and what price per share would be fair if that story plays out, so you are not just reacting to headline PE ratios or short term price moves.
On Simply Wall St, Narratives live in the Community page and are used by millions of investors. They let you easily pick or adjust assumptions and then see a live fair value that you can compare with the current share price to consider whether SharkNinja looks like a buy, a hold, or a potential sell.
Because Narratives are dynamically updated when new information like earnings, guidance or major product launches arrives, you can watch how different perspectives evolve. For example, one SharkNinja Narrative might assume fair value around $175 on strong AI powered product expansion and global growth, while a more cautious Narrative might sit closer to $117 based on margin and competition risks.
Do you think there's more to the story for SharkNinja? Head over to our Community to see what others are saying!

This article by Simply Wall St is general in nature. We provide commentary based on historical data and analyst forecasts only using an unbiased methodology and our articles are not intended to be financial advice. It does not constitute a recommendation to buy or sell any stock, and does not take account of your objectives, or your financial situation. We aim to bring you long-term focused analysis driven by fundamental data. Note that our analysis may not factor in the latest price-sensitive company announcements or qualitative material. Simply Wall St has no position in any stocks mentioned.
Have feedback on this article? Concerned about the content? Get in touch with us directly. Alternatively, email editorial-team@simplywallst.com