
Does MSC Industrial’s Steady 2025 Share Price Momentum Match Its Fundamentals?
- Wondering if MSC Industrial Direct is quietly trading at a bargain or already priced for perfection? This breakdown will help you decide whether the current share price makes sense.
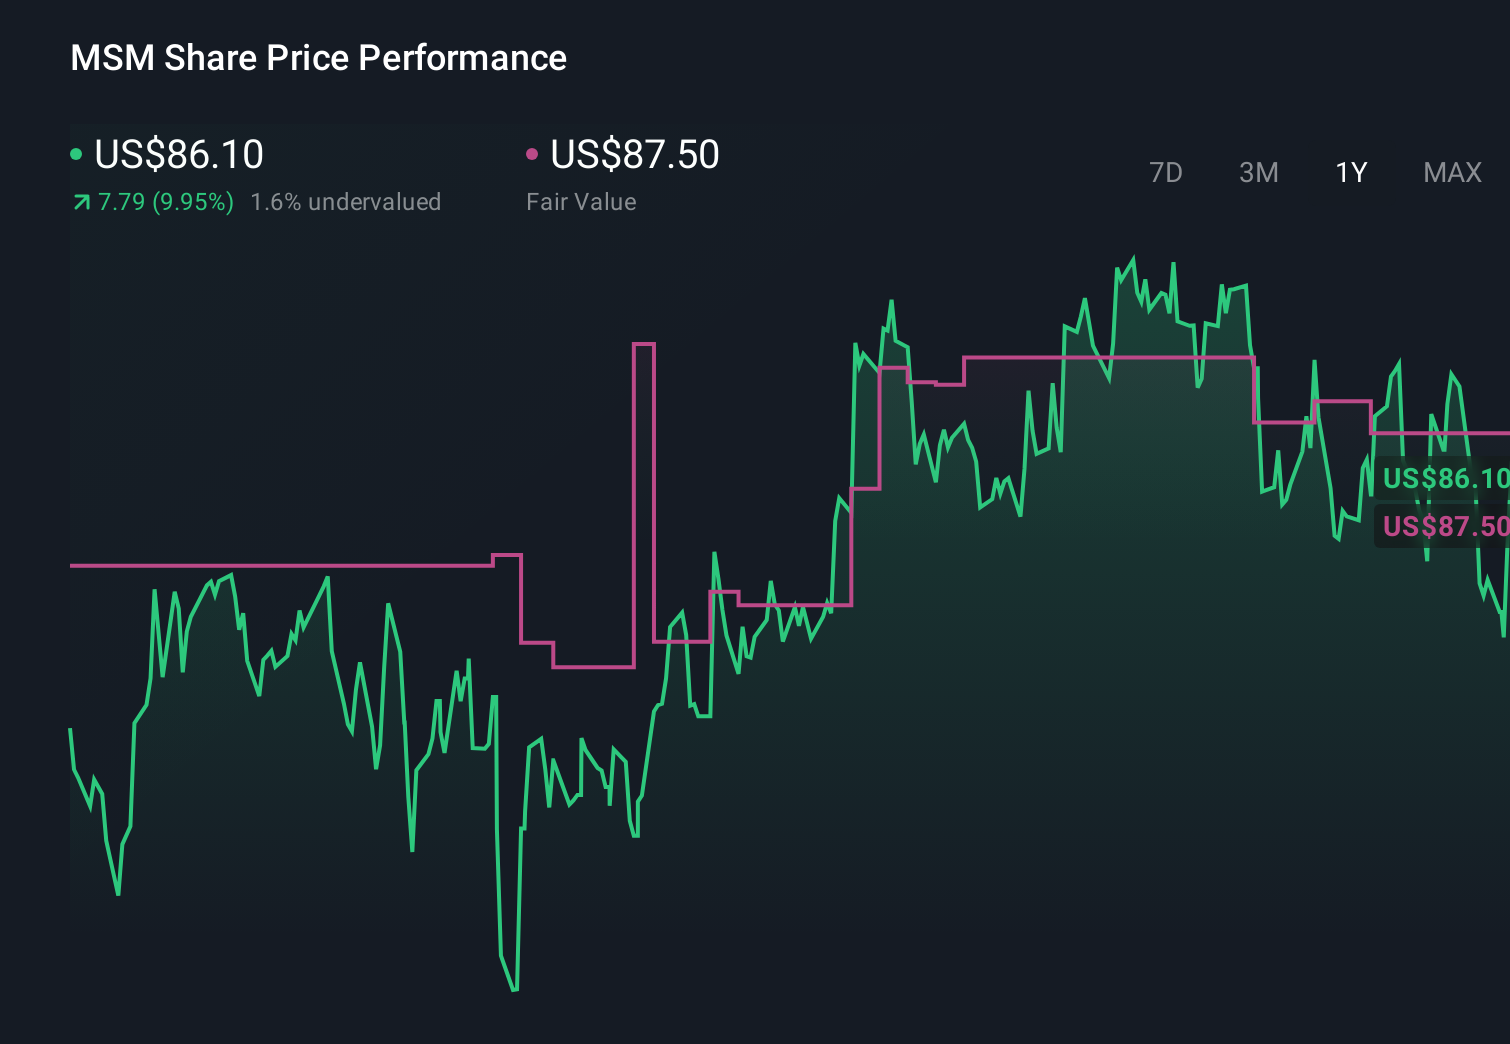
- The stock has nudged up 2.1% over the last week and 0.4% over the past month, but a 14.4% gain year to date and 14.6% over the last year suggest a steady, rather than explosive, re rating.
- Recent attention has focused on how MSC is navigating the broader industrial and manufacturing cycle, including shifting customer demand and ongoing supply chain normalization. Investors are also watching how its strategic initiatives and cost discipline position the company as industrial activity stabilizes.
- Despite those tailwinds, MSC Industrial Direct currently scores just 0/6 on our valuation checks. We will unpack this using multiple valuation approaches, before turning to an even better way to think about what the stock is really worth in the long run.
MSC Industrial Direct scores just 0/6 on our valuation checks. See what other red flags we found in the full valuation breakdown.
Approach 1: MSC Industrial Direct Discounted Cash Flow (DCF) Analysis
A Discounted Cash Flow model estimates what a business is worth today by projecting the cash it can generate in the future and then discounting those cash flows back to a present value. For MSC Industrial Direct, this is done using a 2 Stage Free Cash Flow to Equity framework that focuses on cash available to shareholders.
Right now, MSC is generating trailing twelve month free cash flow of about $241.3 Million. Based on analyst forecasts for the next few years and then Simply Wall St extrapolations beyond that, free cash flow is projected to trend around $248 Million by 2030, with modest growth followed by a gradual slowdown reflected in the later year estimates.
When those projected cash flows are discounted back using this DCF approach, the resulting intrinsic value comes out at roughly $60.29 per share. Compared with the current share price, this implies the stock is about 42.8% overvalued. This suggests investors are already paying up for future growth.
Result: OVERVALUED
Our Discounted Cash Flow (DCF) analysis suggests MSC Industrial Direct may be overvalued by 42.8%. Discover 911 undervalued stocks or create your own screener to find better value opportunities.

Approach 2: MSC Industrial Direct Price vs Earnings
For consistently profitable businesses like MSC Industrial Direct, the price to earnings multiple is a straightforward way to gauge whether investors are paying a reasonable price for each dollar of current earnings. In general, faster expected growth and lower perceived risk justify a higher PE ratio, while slower growth or greater uncertainty point to a lower, more conservative multiple.
MSC Industrial Direct is currently trading on a PE of about 24.10x. That is above both the Trade Distributors industry average of roughly 19.87x and the broader peer group average of around 20.98x, suggesting the market is already assigning the stock a premium. To refine that view, Simply Wall St uses a proprietary Fair Ratio, which estimates what a normal PE should be for this company given its earnings growth outlook, profitability, industry, market cap and specific risk profile.
This Fair Ratio for MSC comes out at about 20.73x, which is lower than the current 24.10x market multiple. Because the Fair Ratio adjusts for growth, risk and quality, it offers a more tailored benchmark than blunt peer or industry comparisons, and on that basis, the shares look somewhat expensive at today’s price.
Result: OVERVALUED

PE ratios tell one story, but what if the real opportunity lies elsewhere? Discover 1463 companies where insiders are betting big on explosive growth.
Upgrade Your Decision Making: Choose your MSC Industrial Direct Narrative
Earlier we mentioned that there is an even better way to understand valuation. Let us introduce you to Narratives, a simple tool on Simply Wall St’s Community page that lets you attach your story about MSC Industrial Direct to the numbers. It does this by linking your view on its future revenue, earnings and margins to a financial forecast, converting that into a Fair Value, and then continuously comparing that Fair Value to the latest share price so you can judge when to buy or sell. The Narrative itself updates as fresh information like news or earnings arrives. This means one investor might build a bullish MSC view closer to $105 per share based on strong execution in In Plant programs, digital growth and margin expansion. Another might take a more cautious stance nearer $81 per share given soft short cycle demand and macro risks. Yet both are using the same structured, dynamic framework to turn their perspective into a living valuation that can evolve over time.
Do you think there's more to the story for MSC Industrial Direct? Head over to our Community to see what others are saying!
This article by Simply Wall St is general in nature. We provide commentary based on historical data and analyst forecasts only using an unbiased methodology and our articles are not intended to be financial advice. It does not constitute a recommendation to buy or sell any stock, and does not take account of your objectives, or your financial situation. We aim to bring you long-term focused analysis driven by fundamental data. Note that our analysis may not factor in the latest price-sensitive company announcements or qualitative material. Simply Wall St has no position in any stocks mentioned.
Have feedback on this article? Concerned about the content? Get in touch with us directly. Alternatively, email editorial-team@simplywallst.com