
Is Alphabet Still Attractively Priced After Its 2024 AI Fueled Surge?
- If you are wondering whether Alphabet is still a smart buy after its massive run, or if you are late to the party, this piece will walk through what the current share price really implies about future returns.
- Despite a 5.0% pullback over the last week, Alphabet is still up 4.4% over the past month, 56.6% year to date, and 58.0% over the last year, building on multi year gains of 240.7% over 3 years and 244.8% over 5 years.
- Recent price moves have come alongside steady progress in Alphabet's core search, YouTube, and cloud businesses, plus a renewed spotlight on its artificial intelligence capabilities as investors reassess which tech giants can sustain profitable AI driven growth. Policy and regulatory debates around big tech, especially in the US and Europe, have also added a layer of risk perception that tends to amplify swings in sentiment.
- On our framework, Alphabet scores a 2/6 valuation score, suggesting it looks undervalued on only a couple of key checks. We will break down what different valuation methods say about the stock today, and then finish by looking at a more complete way to judge whether the current price really makes sense.
Alphabet scores just 2/6 on our valuation checks. See what other red flags we found in the full valuation breakdown.
Approach 1: Alphabet Discounted Cash Flow (DCF) Analysis
A Discounted Cash Flow model estimates what a company is worth by projecting its future cash flows and then discounting them back into todays dollars. For Alphabet, we use a two stage Free Cash Flow to Equity approach, which allows for faster growth in the near term before fading to more mature levels.
Alphabet generated about $92.6 billion of free cash flow over the last twelve months, a substantial cash engine to build from. Analyst and extrapolated projections used in this model see free cash flow rising to roughly $254.8 billion by 2035, with the path including $157.7 billion by 2029, reflecting strong but gradually slowing growth as the business scales.
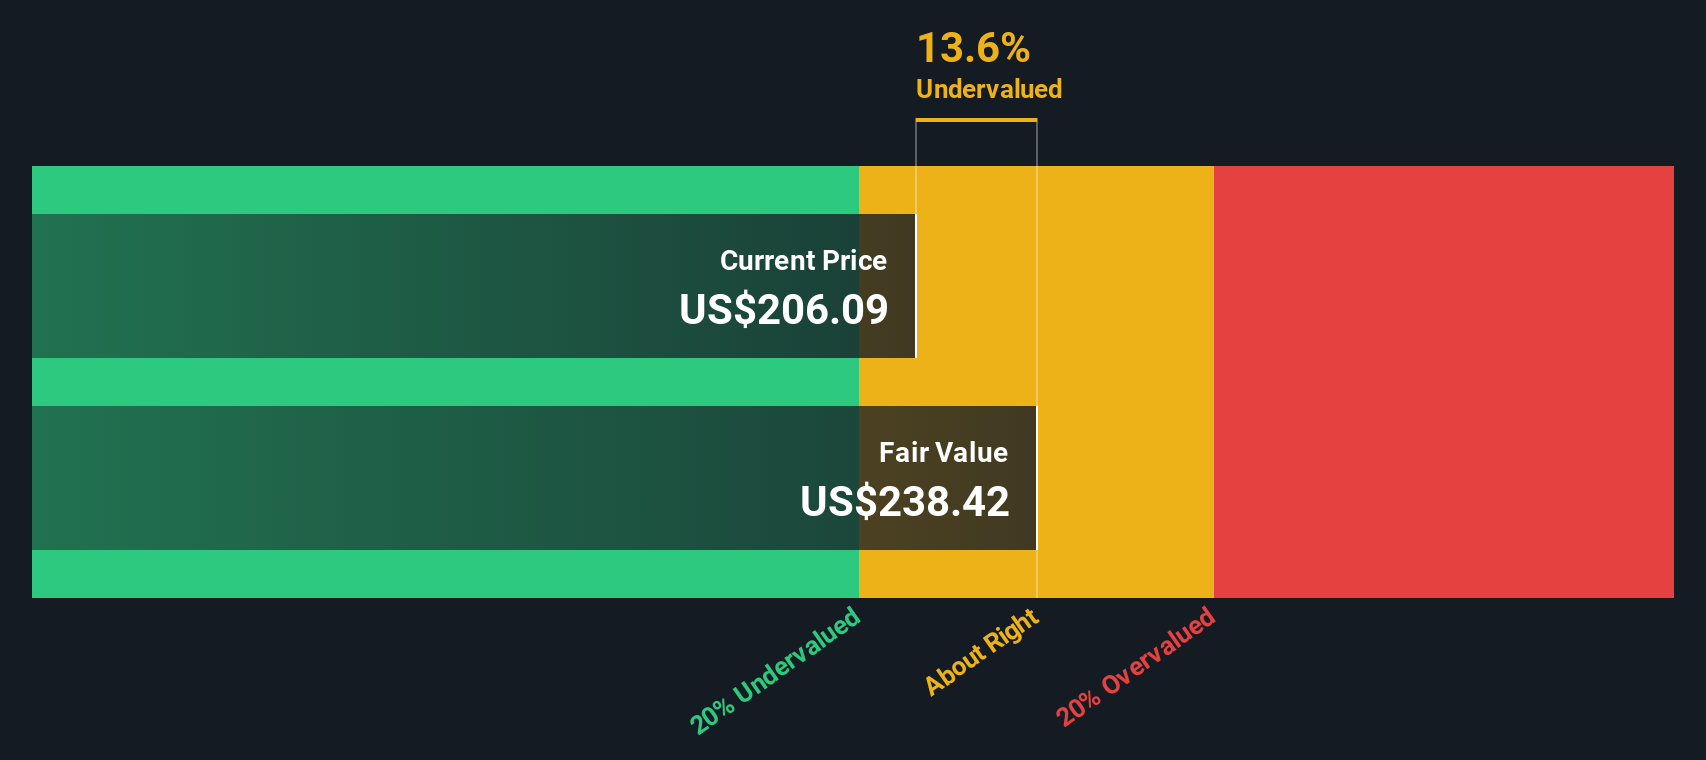
Putting these projected cash flows together, Simply Wall St arrives at an intrinsic value of about $287.66 per share. That is roughly 3.1% below the current market price, implying the stock screens as slightly overvalued on this model, but only marginally so and well within a reasonable margin of error for such forecasts.
Result: ABOUT RIGHT
Alphabet is fairly valued according to our Discounted Cash Flow (DCF), but this can change at a moment's notice. Track the value in your watchlist or portfolio and be alerted on when to act.
Approach 2: Alphabet Price vs Earnings
For a profitable, relatively mature business like Alphabet, the price to earnings ratio is a natural way to value the stock because it ties the share price directly to the profits that shareholders ultimately care about. In general, companies with stronger, more reliable growth and lower perceived risk can justify a higher normal PE. Slower growing or riskier firms tend to trade on lower multiples.
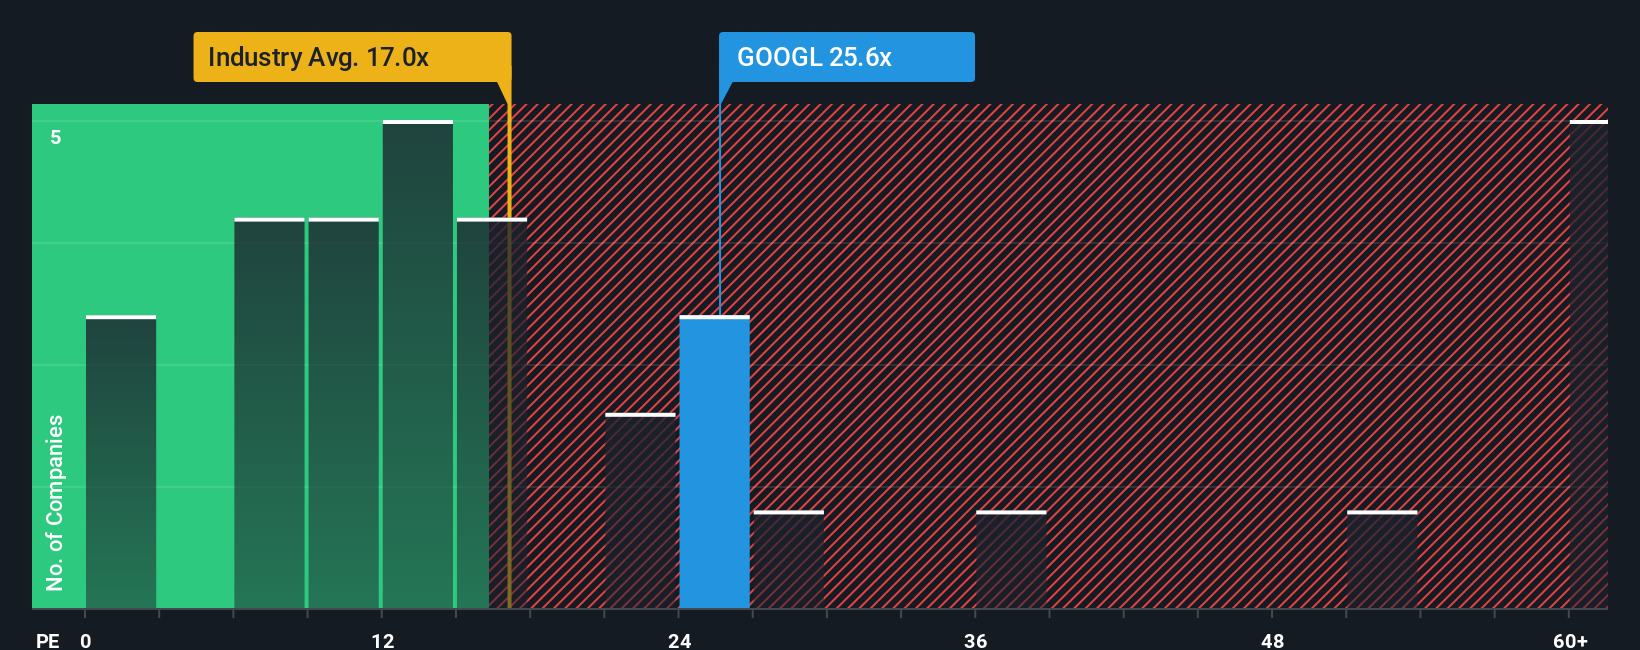
Alphabet currently trades on about 28.8x earnings. That is well above the broader Interactive Media and Services industry average of roughly 16.3x, but still at a discount to large cap peers, which average around 48.6x. Simply Wall St also calculates a proprietary Fair Ratio for Alphabet of about 37.2x. This metric estimates what PE the company should trade on after accounting for its specific earnings growth outlook, profitability, industry positioning, size, and risk profile, making it more tailored than a simple comparison with peers or the sector.
With the current PE sitting below the 37.2x Fair Ratio, this framework suggests Alphabet screens as undervalued on an earnings multiple basis.
Result: UNDERVALUED
PE ratios tell one story, but what if the real opportunity lies elsewhere? Discover 1463 companies where insiders are betting big on explosive growth.
Upgrade Your Decision Making: Choose your Alphabet Narrative
Earlier we mentioned that there is an even better way to understand valuation, so let us introduce you to Narratives, a simple way to connect your view of Alphabet’s story to a set of financial forecasts and a fair value estimate, then compare that to today’s price to decide whether it looks like a buy, a hold, or a sell.
On Simply Wall St, Narratives live in the Community page and let millions of investors turn their qualitative perspective into numbers by laying out assumptions for future revenue, earnings and margins. The platform then converts these into a dynamic fair value that automatically refreshes as new earnings, news or guidance land.
For Alphabet, for example, one investor Narrative on the platform currently assumes a fair value near $171 per share based on more modest growth and a higher discount rate. A more optimistic Narrative sees fair value closer to $340 with faster AI and cloud driven expansion. By comparing those fair values to Alphabet’s market price, each investor can act in line with their own story driven view rather than a single static metric.
For Alphabet however we will make it really easy for you with previews of two leading Alphabet Narratives:
Fair value: $340.00
Implied undervaluation vs latest close: 12.7%
Revenue growth assumption: 17.36%
- Sees Alphabet as a cash generating powerhouse, combining dominant digital ads, a now profitable Google Cloud, and deep AI expertise from DeepMind and Gemini across the ecosystem.
- Highlights a fortress balance sheet with over $120B in cash, minimal debt, robust free cash flow, and growing buybacks that support a higher future P/E multiple.
- Argues that Berkshire’s stake could add a modest Buffett premium as markets re rate Alphabet as a durable quality compounder rather than just an ad cyclical.
Fair value: $212.34
Implied overvaluation vs latest close: 39.7%
Revenue growth assumption: 13.47%
- Expects digital advertising and cloud to keep growing, but argues the current share price already prices in much of that upside with limited margin of safety.
- Views generative AI as sustaining rather than disruptive for Alphabet, but stresses near term profitability constraints from high compute costs and regulatory risks.
- Assumes steady but not explosive growth in Google Services and Cloud, with improved margins from cost cutting, leading to a lower long term fair value than today’s market price.
Do you think there's more to the story for Alphabet? Head over to our Community to see what others are saying!

This article by Simply Wall St is general in nature. We provide commentary based on historical data and analyst forecasts only using an unbiased methodology and our articles are not intended to be financial advice. It does not constitute a recommendation to buy or sell any stock, and does not take account of your objectives, or your financial situation. We aim to bring you long-term focused analysis driven by fundamental data. Note that our analysis may not factor in the latest price-sensitive company announcements or qualitative material. Simply Wall St has no position in any stocks mentioned.
Have feedback on this article? Concerned about the content? Get in touch with us directly. Alternatively, email editorial-team@simplywallst.com