
Stock Yards Bancorp (SYBT): Taking a Fresh Look at Valuation After Recent Share Price Stability
Stock Yards Bancorp (SYBT) has quietly slipped around 1% over the past week while still holding a solid gain over the past month, a setup that invites a closer look at valuation and earnings power.
See our latest analysis for Stock Yards Bancorp.
The recent 1 month share price return of 6.22 percent, despite a softer 90 day share price performance, suggests sentiment is stabilising around Stock Yards Bancorp as investors reassess its earnings resilience and income appeal, especially given its solid 5 year total shareholder return of 88.27 percent.
If this kind of steady, fundamentals driven story appeals to you, it could be worth exploring fast growing stocks with high insider ownership to spot other potential long term compounders on your radar.
But with the shares trading at a material discount to both analysts’ price targets and some estimates of intrinsic value, investors now face a dilemma: Is Stock Yards Bancorp an overlooked opportunity, or is the market already baking in its growth?
Price-to-Earnings of 14.9x: Is it justified?
On a headline basis, Stock Yards Bancorp's 14.9x price to earnings ratio at a 68.27 dollar share price signals a market willing to pay a premium for each dollar of current earnings relative to many direct peers.
The price to earnings multiple compares the current share price with the company’s per share earnings, a core yardstick for valuing profitable banks like Stock Yards Bancorp. For a mature regional bank with an established deposit base and steady fee income, this ratio helps investors judge how much future earnings power is already embedded in the price.
Compared with its peer group, SYBT's 14.9x price to earnings ratio looks attractive against the wider peer average of 29.8x. This suggests the market is paying roughly half the peer multiple for a bank that has delivered 26.6 percent earnings growth over the past year and improved net profit margins. However, versus the broader US banks industry average of 12x and an estimated fair price to earnings ratio of 10.9x, the shares look richer, implying the market could still compress the multiple closer to that fair level if growth moderates.
Explore the SWS fair ratio for Stock Yards Bancorp
Result: Price-to-Earnings of 14.9x (UNDERVALUED)
However, risks remain, including potential margin pressure if deposit costs rise faster than loan yields and weaker regional credit conditions hitting earnings momentum.
Find out about the key risks to this Stock Yards Bancorp narrative.
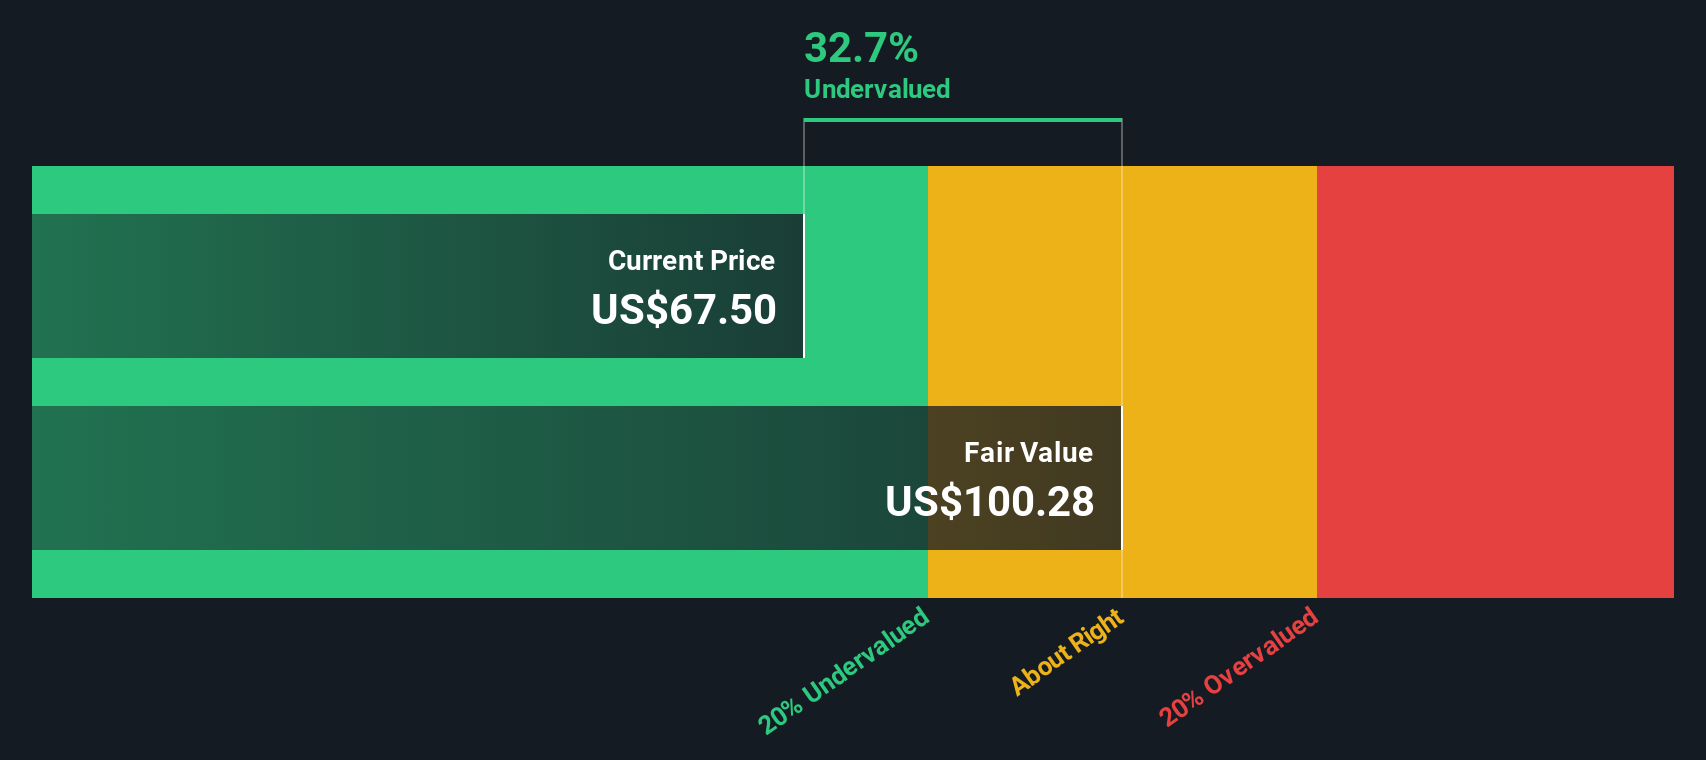
Another Take on Value: What Our DCF Says
While the earnings multiple hints at reasonable value, our DCF model presents a stronger case. It suggests fair value near $103.19 versus today’s $68.27. That 33.8 percent discount implies the market could be underestimating Stock Yards Bancorp’s long term cash generation, or it may be exercising appropriate caution.
Look into how the SWS DCF model arrives at its fair value.
Simply Wall St performs a discounted cash flow (DCF) on every stock in the world every day (check out Stock Yards Bancorp for example). We show the entire calculation in full. You can track the result in your watchlist or portfolio and be alerted when this changes, or use our stock screener to discover 912 undervalued stocks based on their cash flows. If you save a screener we even alert you when new companies match - so you never miss a potential opportunity.
Build Your Own Stock Yards Bancorp Narrative
If you see things differently or simply prefer to dig into the numbers yourself, you can build a personalised view in just minutes using Do it your way.
A good starting point is our analysis highlighting 4 key rewards investors are optimistic about regarding Stock Yards Bancorp.
Ready for your next investing move?
Do not stop at one opportunity when the market is full of potential. Use the Simply Wall Street Screener to uncover your next smart idea today.
- Capitalize on mispriced opportunities by targeting companies trading below their cash flow potential through these 912 undervalued stocks based on cash flows, before the rest of the market catches on.
- Position yourself at the forefront of technological change by zeroing in on breakthrough innovators using these 26 AI penny stocks, where growth and disruption intersect.
- Lock in reliable income streams by focusing on payout heavy businesses via these 13 dividend stocks with yields > 3%, so your portfolio keeps working even when markets cool.
This article by Simply Wall St is general in nature. We provide commentary based on historical data and analyst forecasts only using an unbiased methodology and our articles are not intended to be financial advice. It does not constitute a recommendation to buy or sell any stock, and does not take account of your objectives, or your financial situation. We aim to bring you long-term focused analysis driven by fundamental data. Note that our analysis may not factor in the latest price-sensitive company announcements or qualitative material. Simply Wall St has no position in any stocks mentioned.
Have feedback on this article? Concerned about the content? Get in touch with us directly. Alternatively, email editorial-team@simplywallst.com