
Rusoro Mining Ltd.'s (CVE:RML) last week's 10% decline must have disappointed retail investors who have a significant stake
Key Insights
- Rusoro Mining's significant retail investors ownership suggests that the key decisions are influenced by shareholders from the larger public
- 44% of the business is held by the top 8 shareholders
- Insiders own 23% of Rusoro Mining
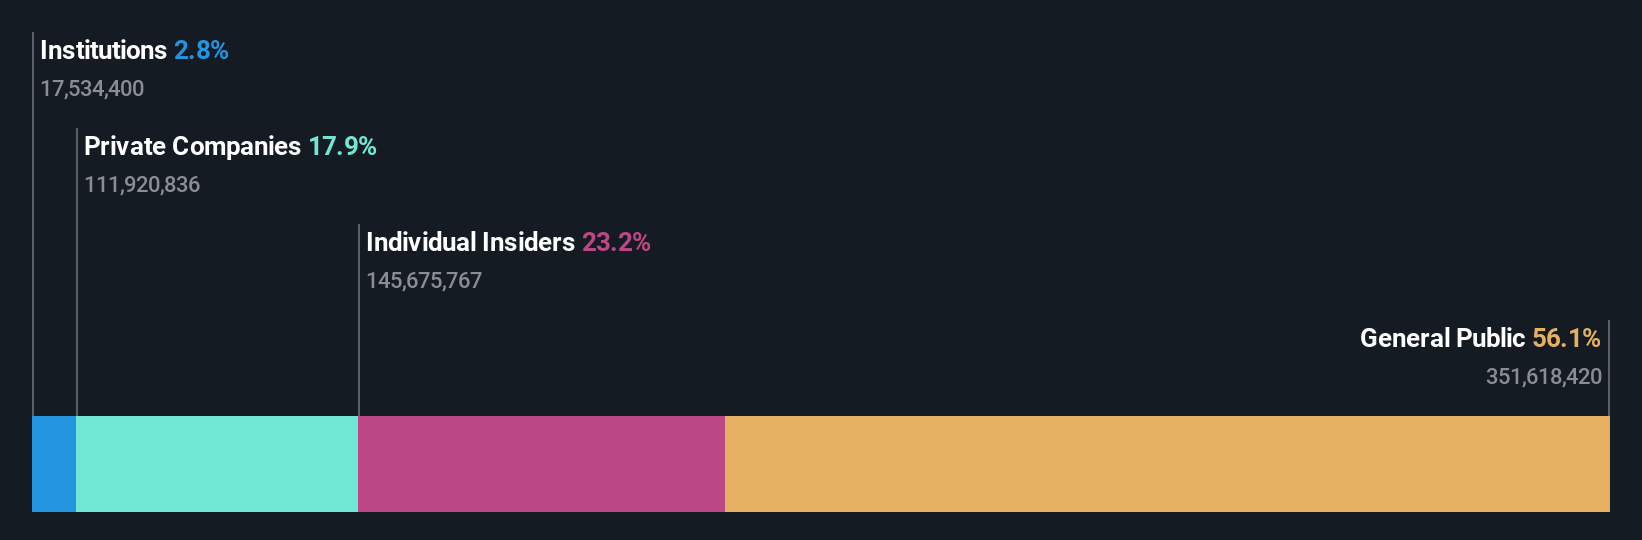
A look at the shareholders of Rusoro Mining Ltd. (CVE:RML) can tell us which group is most powerful. With 56% stake, retail investors possess the maximum shares in the company. In other words, the group stands to gain the most (or lose the most) from their investment into the company.
While insiders, who own 23% shares weren’t spared from last week’s CA$63m market cap drop, retail investors as a group suffered the maximum losses
Let's delve deeper into each type of owner of Rusoro Mining, beginning with the chart below.
See our latest analysis for Rusoro Mining
What Does The Institutional Ownership Tell Us About Rusoro Mining?
Institutional investors commonly compare their own returns to the returns of a commonly followed index. So they generally do consider buying larger companies that are included in the relevant benchmark index.
Institutions have a very small stake in Rusoro Mining. That indicates that the company is on the radar of some funds, but it isn't particularly popular with professional investors at the moment. If the company is growing earnings, that may indicate that it is just beginning to catch the attention of these deep-pocketed investors. When multiple institutional investors want to buy shares, we often see a rising share price. The past revenue trajectory (shown below) can be an indication of future growth, but there are no guarantees.

Hedge funds don't have many shares in Rusoro Mining. The company's largest shareholder is SPCP Luxembourg Strategies Sarl, with ownership of 13%. Andrei Agapov is the second largest shareholder owning 11% of common stock, and Peter Hediger holds about 6.2% of the company stock. Two of the top three shareholders happen to be Chief Executive Officer and Member of the Board of Directors, respectively. That is, insiders feature higher up in the heirarchy of the company's top shareholders.
A deeper look at our ownership data shows that the top 8 shareholders collectively hold less than half of the register, suggesting a large group of small holders where no single shareholder has a majority.
While it makes sense to study institutional ownership data for a company, it also makes sense to study analyst sentiments to know which way the wind is blowing. As far as we can tell there isn't analyst coverage of the company, so it is probably flying under the radar.
Insider Ownership Of Rusoro Mining
The definition of company insiders can be subjective and does vary between jurisdictions. Our data reflects individual insiders, capturing board members at the very least. Company management run the business, but the CEO will answer to the board, even if he or she is a member of it.
Most consider insider ownership a positive because it can indicate the board is well aligned with other shareholders. However, on some occasions too much power is concentrated within this group.
It seems insiders own a significant proportion of Rusoro Mining Ltd.. It has a market capitalization of just CA$577m, and insiders have CA$134m worth of shares in their own names. It is great to see insiders so invested in the business. It might be worth checking if those insiders have been buying recently.
General Public Ownership
The general public -- including retail investors -- own 56% of Rusoro Mining. This level of ownership gives investors from the wider public some power to sway key policy decisions such as board composition, executive compensation, and the dividend payout ratio.
Private Company Ownership
We can see that Private Companies own 18%, of the shares on issue. Private companies may be related parties. Sometimes insiders have an interest in a public company through a holding in a private company, rather than in their own capacity as an individual. While it's hard to draw any broad stroke conclusions, it is worth noting as an area for further research.
Next Steps:
It's always worth thinking about the different groups who own shares in a company. But to understand Rusoro Mining better, we need to consider many other factors. For instance, we've identified 4 warning signs for Rusoro Mining that you should be aware of.
If you would prefer check out another company -- one with potentially superior financials -- then do not miss this free list of interesting companies, backed by strong financial data.
NB: Figures in this article are calculated using data from the last twelve months, which refer to the 12-month period ending on the last date of the month the financial statement is dated. This may not be consistent with full year annual report figures.
Have feedback on this article? Concerned about the content? Get in touch with us directly. Alternatively, email editorial-team (at) simplywallst.com.
This article by Simply Wall St is general in nature. We provide commentary based on historical data and analyst forecasts only using an unbiased methodology and our articles are not intended to be financial advice. It does not constitute a recommendation to buy or sell any stock, and does not take account of your objectives, or your financial situation. We aim to bring you long-term focused analysis driven by fundamental data. Note that our analysis may not factor in the latest price-sensitive company announcements or qualitative material. Simply Wall St has no position in any stocks mentioned.