
Has the Recent 18% Rally Left BHP Priced Fairly for 2025?
- Wondering whether BHP Group is still a smart buy at today’s price, or if the big gains are already behind it? This article will walk you through what the numbers are really saying about its value.
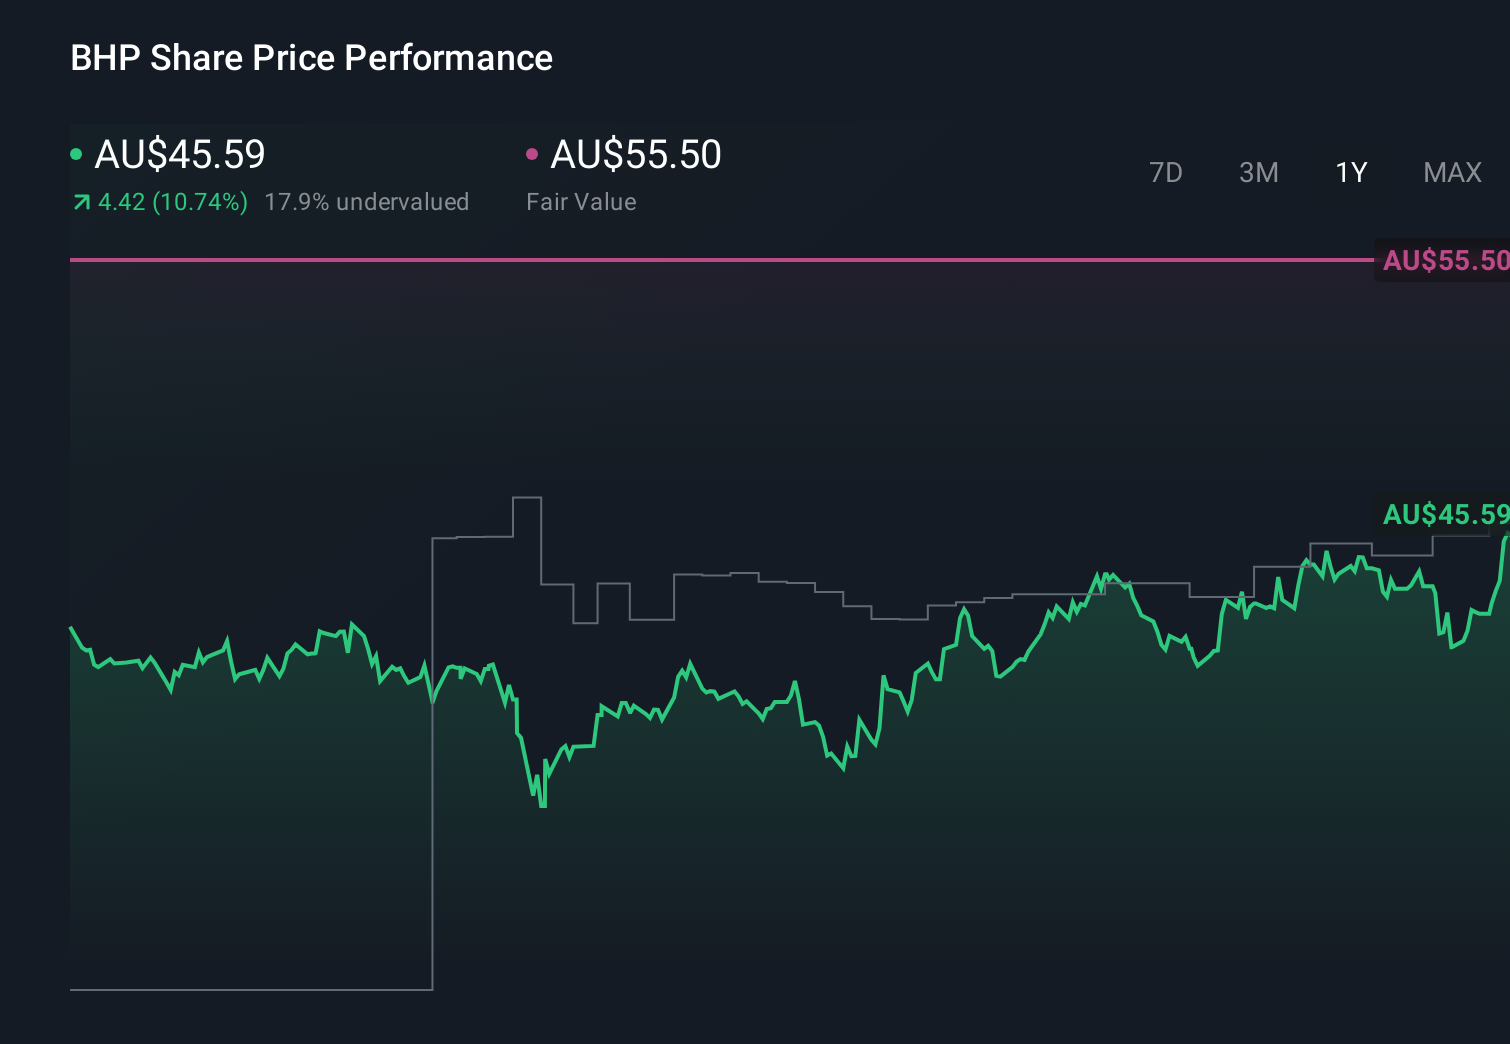
- After a 9.7% rise over the last month and an 18.0% return over the past year, BHP’s recent performance is hard to ignore for anyone tracking long term compounders.
- Much of this momentum has been underpinned by shifting expectations around iron ore and copper demand, as investors weigh long term infrastructure and energy transition themes. At the same time, headlines around capital allocation, including ongoing project spending and portfolio reshaping, have helped shape the market’s view of both growth potential and risk.
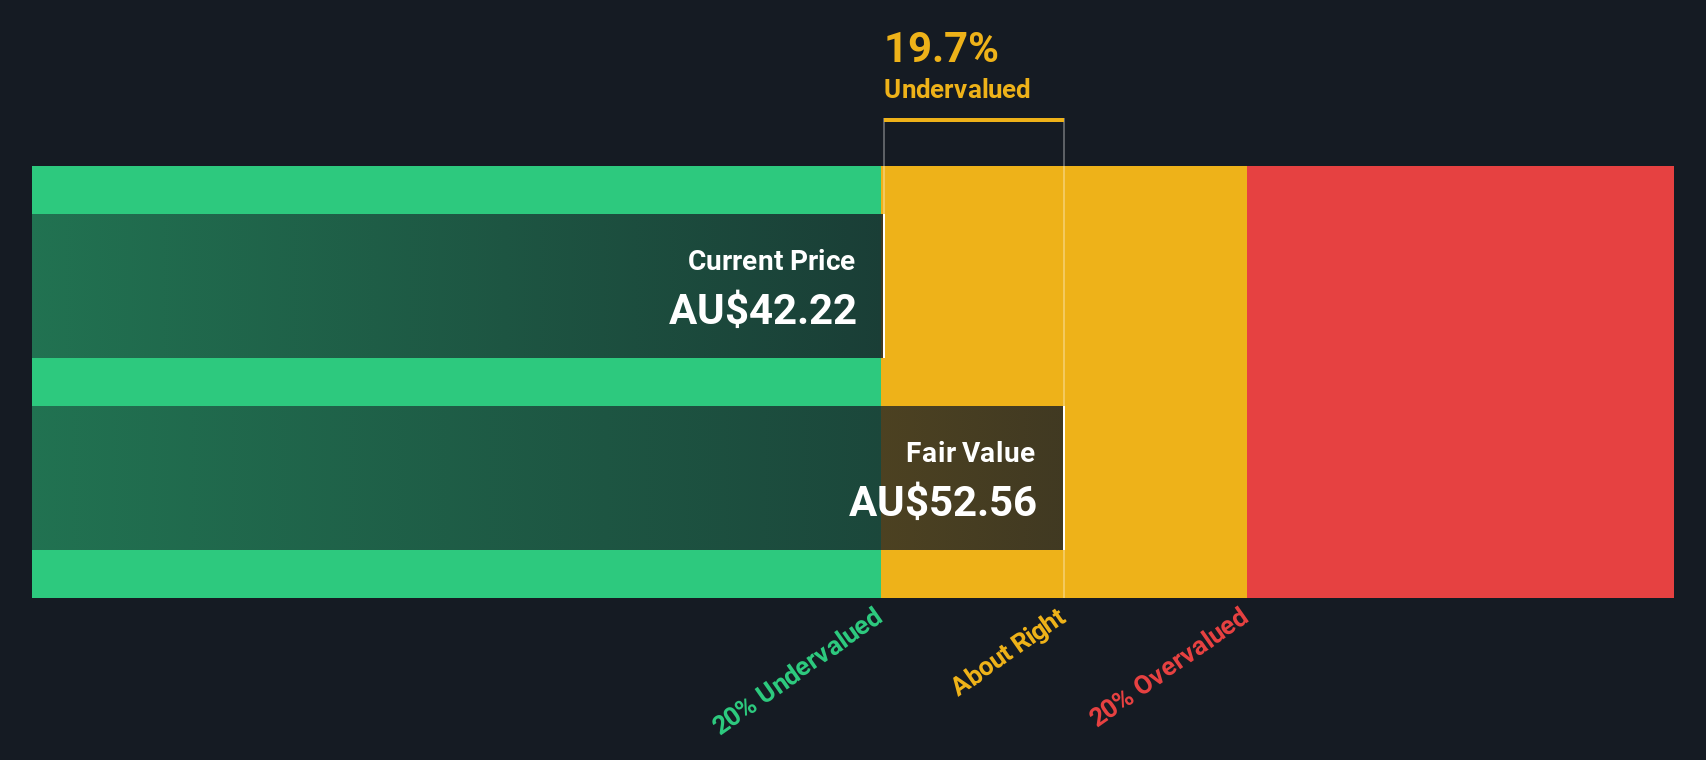
- On our valuation framework BHP scores a 4/6 for being undervalued across six key checks, suggesting some upside still baked into the current price. Next we will break down how different valuation approaches look for BHP, and then finish with a way to interpret that valuation in the wider context of its long term story.
Find out why BHP Group's 18.0% return over the last year is lagging behind its peers.
Approach 1: BHP Group Discounted Cash Flow (DCF) Analysis
A Discounted Cash Flow model estimates what a company is worth today by projecting the cash it can generate in the future and then discounting those cash flows back to the present.
For BHP Group, the model uses a 2 Stage Free Cash Flow to Equity approach based on cash flow projections. The latest twelve months free cash flow is about $10.35 billion, and analysts see this staying around the $9 billion to $11 billion range over the next decade, with 2030 free cash flow projected at roughly $10.23 billion. Analyst forecasts are available for the next few years, and beyond that Simply Wall St extrapolates the trend to complete the 10 year view.
On these assumptions, the DCF model arrives at an intrinsic value of about $46.86 per share, implying the stock is trading at roughly a 4.2% discount to its estimated fair value. That places BHP in the “around fair value” zone rather than at an extreme of being very cheap or very expensive.
Result: ABOUT RIGHT
BHP Group is fairly valued according to our Discounted Cash Flow (DCF), but this can change at a moment's notice. Track the value in your watchlist or portfolio and be alerted on when to act.
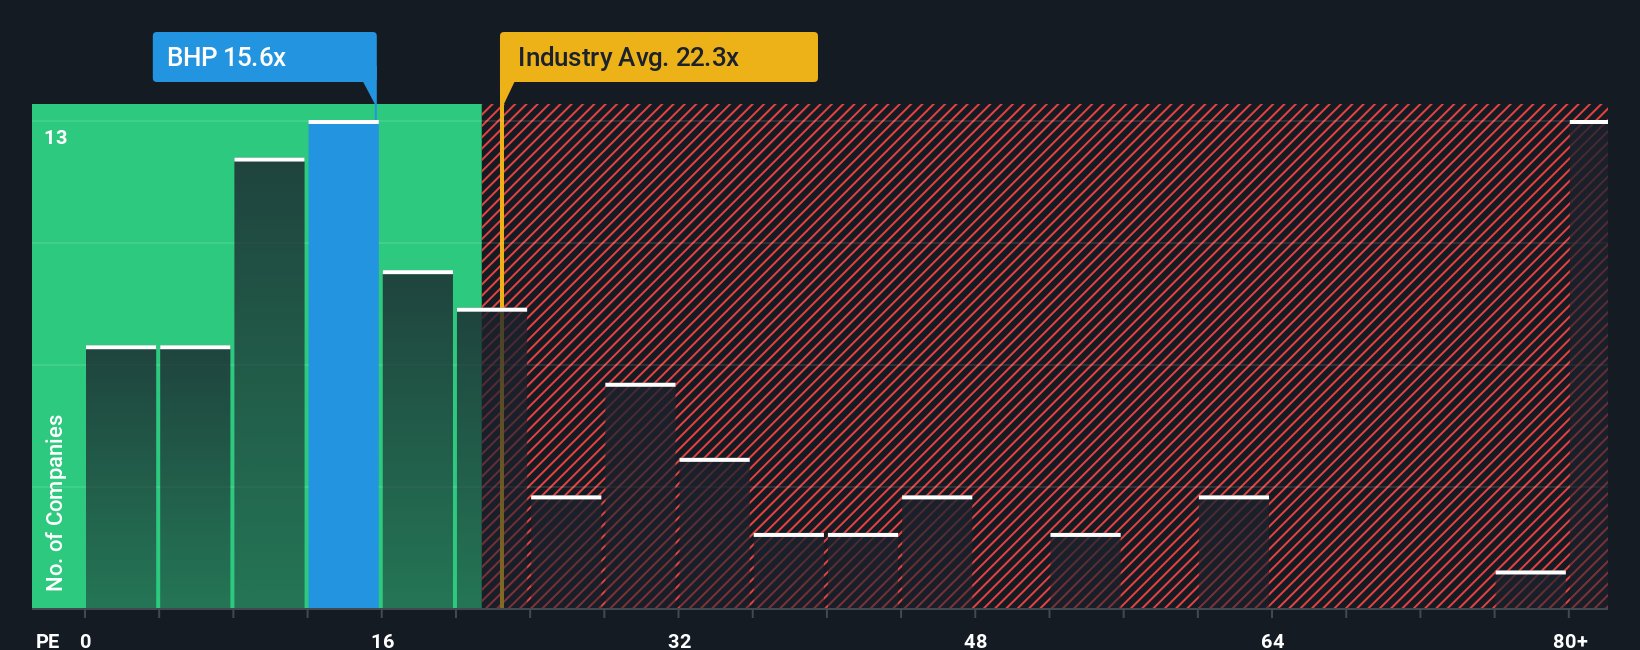
Approach 2: BHP Group Price vs Earnings
For companies that are consistently profitable like BHP Group, the price to earnings, or PE, ratio is a straightforward way to gauge whether investors are paying a sensible price for each dollar of current earnings. A higher PE can be justified when markets expect stronger, more durable growth and see lower risk in those earnings, while slower growth or higher uncertainty usually calls for a lower, more conservative multiple.
BHP currently trades on a PE of about 16.7x, which is below both the broader Metals and Mining industry average of roughly 22.7x and the peer group average near 19.9x. That discount might initially suggest value, but headline comparisons do not fully reflect BHP’s specific growth profile, profitability, scale and risk characteristics.
To address this, Simply Wall St uses a proprietary “Fair Ratio” that estimates what PE multiple would be reasonable for BHP given factors like its expected earnings growth, margins, industry positioning, market cap and risk profile. For BHP, that Fair Ratio is a much higher 28.1x, implying the company could warrant a richer valuation than both its current multiple and the simple industry or peer benchmarks suggest, pointing to meaningful undervaluation on this measure.
Result: UNDERVALUED
PE ratios tell one story, but what if the real opportunity lies elsewhere? Discover 1454 companies where insiders are betting big on explosive growth.
Upgrade Your Decision Making: Choose your BHP Group Narrative
Earlier we mentioned that there is an even better way to understand valuation. Let us introduce you to Narratives, a simple way to connect your view of BHP Group’s future to the numbers. You do this by telling a story about its revenue, earnings and margins, turning that story into a financial forecast, and then into a fair value you can compare with today’s share price on Simply Wall St’s Community page. There, millions of investors share and refine their Narratives, which automatically update as new news, earnings and analyst estimates come in. You can see, for example, how a bullish BHP Narrative might assume strong long term copper and potash demand, expanding margins and a fair value well above the current price. A bearish Narrative could instead focus on legal liabilities, Chinese demand risk and tighter margins to arrive at a much lower fair value. This can help you decide whether BHP is a buy, hold or sell based on which story you believe is more likely.
Do you think there's more to the story for BHP Group? Head over to our Community to see what others are saying!
This article by Simply Wall St is general in nature. We provide commentary based on historical data and analyst forecasts only using an unbiased methodology and our articles are not intended to be financial advice. It does not constitute a recommendation to buy or sell any stock, and does not take account of your objectives, or your financial situation. We aim to bring you long-term focused analysis driven by fundamental data. Note that our analysis may not factor in the latest price-sensitive company announcements or qualitative material. Simply Wall St has no position in any stocks mentioned.
Have feedback on this article? Concerned about the content? Get in touch with us directly. Alternatively, email editorial-team@simplywallst.com