
Is Walker & Dunlop’s 2025 Share Price Slide Creating a Long Term Opportunity?
- Wondering if Walker & Dunlop is a beaten down financial stock hiding real value, or cheap for a reason? Let us unpack what the recent share price and fundamentals are really telling us.
- The stock closed at $61.44 recently and is down 3.3% over the last week, 0.6% over the last month, and a hefty 35.6% year to date, which will catch the eye of both bargain hunters and risk conscious investors.
- That slide comes against a backdrop of a challenging commercial real estate and lending environment, with higher interest rates and tighter credit standards weighing on deal activity. At the same time, investors are watching for signs that Walker & Dunlop's capital markets and multifamily financing platforms can stabilize volumes as the market adjusts.
- On our framework, Walker & Dunlop currently scores just 1/6 on valuation checks, suggesting only limited signs of broad undervaluation so far, but headline ratios rarely tell the whole story. Next we will walk through different valuation approaches, and finish by looking at a more holistic way to judge whether the stock is genuinely attractive at these levels.
Walker & Dunlop scores just 1/6 on our valuation checks. See what other red flags we found in the full valuation breakdown.
Approach 1: Walker & Dunlop Excess Returns Analysis
The Excess Returns model looks at how much profit a company can generate above the return that investors require on its equity, then capitalizes those extra profits into an intrinsic value per share.
For Walker & Dunlop, the model starts with a Book Value of $52.89 per share and a Stable EPS estimate of $3.19 per share, based on the median return on equity over the past five years. Against this, the Cost of Equity is estimated at $3.91 per share, implying an Excess Return of negative $0.72 per share. In other words, the model assumes Walker & Dunlop is not currently earning enough on its equity base to cover investors required return.
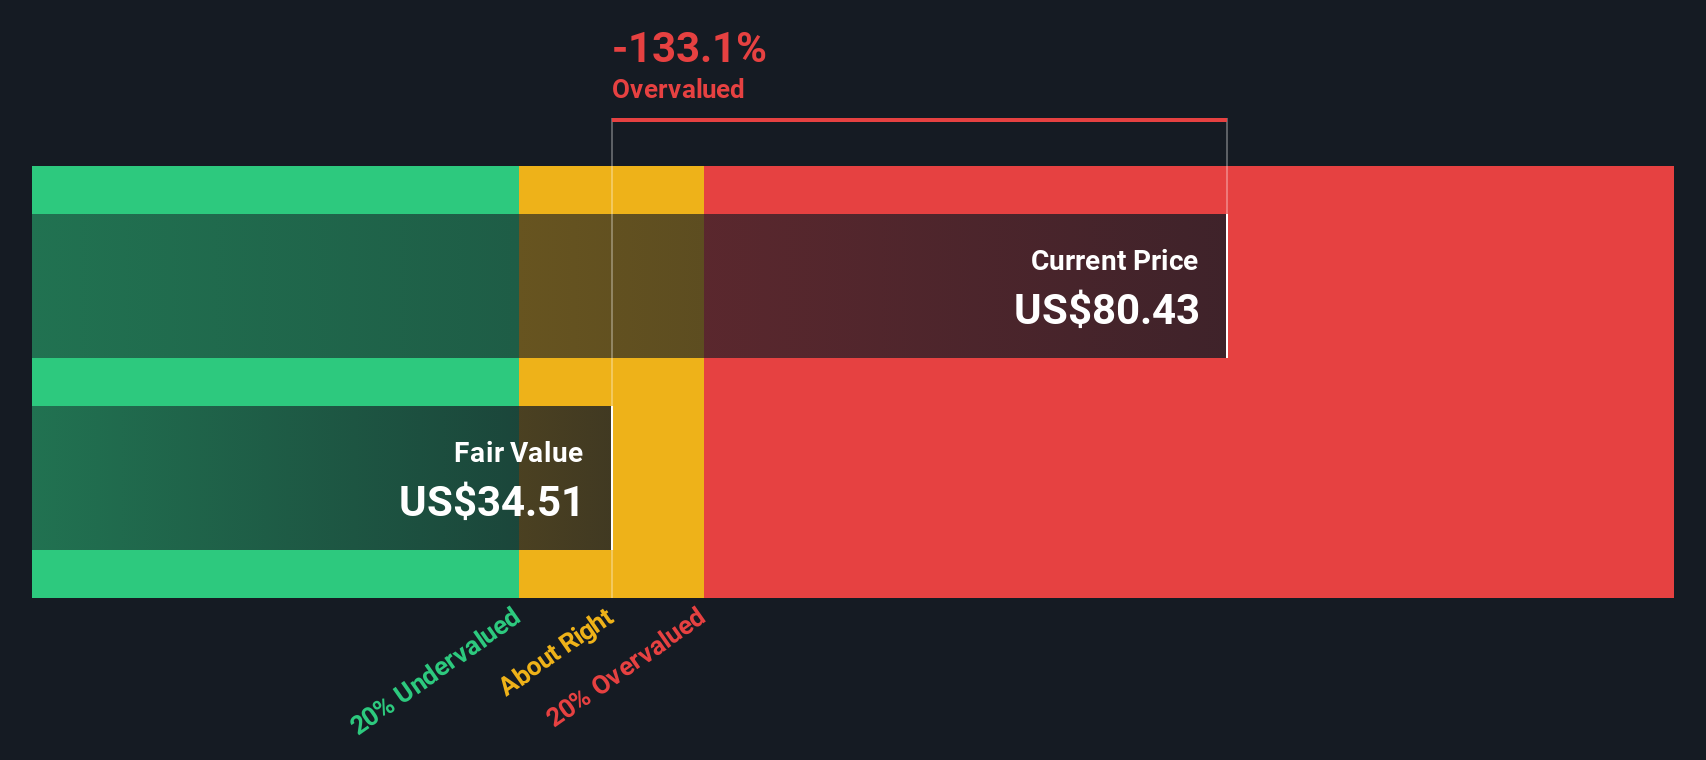
With an Average Return on Equity of 6.14% and a Stable Book Value of $51.95 per share, the Excess Returns framework produces an intrinsic value of about $35.10 per share, roughly 75.0% below the recent market price near $61.44. On this view, the stock screens as materially overvalued rather than an obvious bargain.
Result: OVERVALUED
Our Excess Returns analysis suggests Walker & Dunlop may be overvalued by 75.0%. Discover 912 undervalued stocks or create your own screener to find better value opportunities.
Approach 2: Walker & Dunlop Price vs Earnings
For a profitable company like Walker & Dunlop, the price to earnings (PE) ratio is a practical way to gauge how much investors are paying for each dollar of current earnings. In general, higher growth and lower perceived risk justify a higher PE, while slower growth or elevated risk should translate into a lower, more conservative multiple.
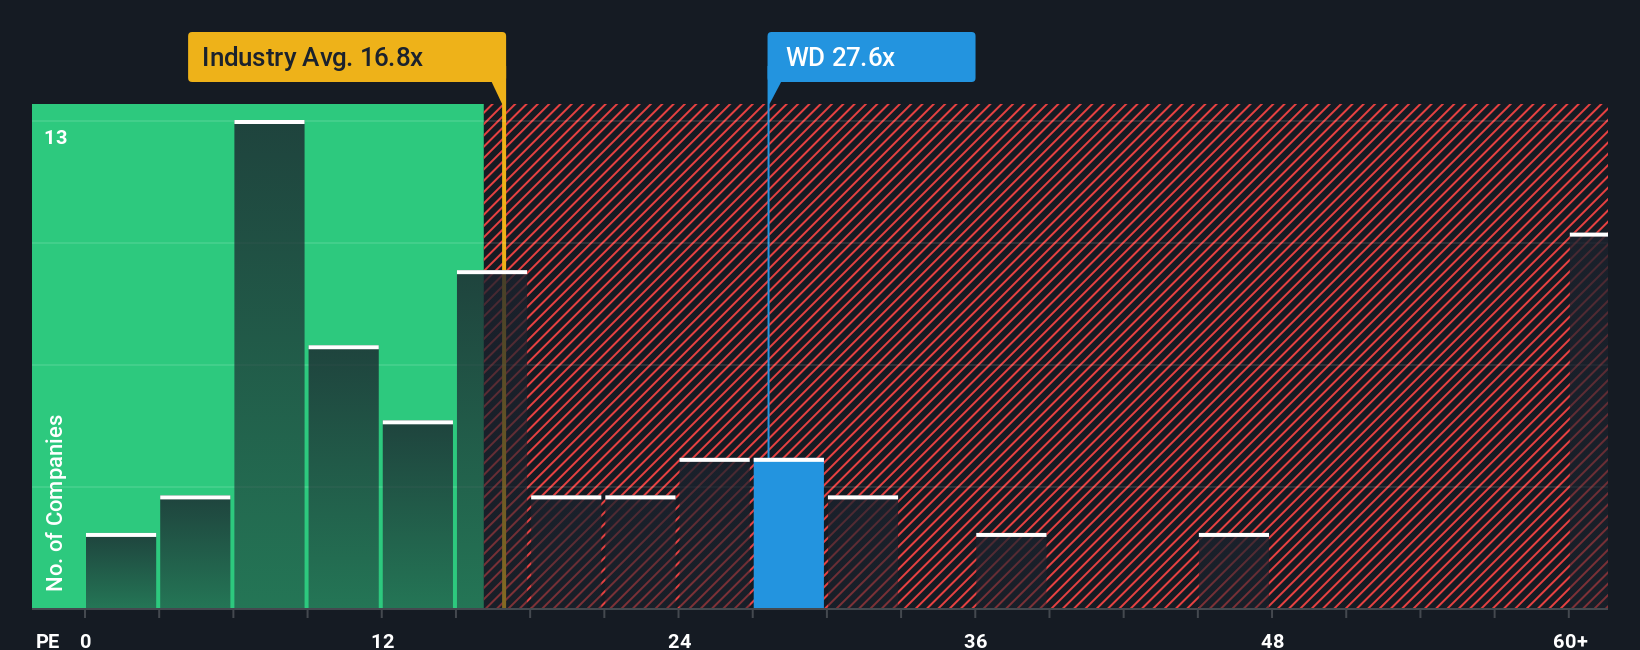
Walker & Dunlop currently trades on a PE of about 18.63x, which is above both the Diversified Financial industry average of roughly 13.57x and the peer group average near 8.81x. On the surface, that suggests the market is assigning the stock a premium relative to many comparable names.
Simply Wall St’s Fair Ratio for Walker & Dunlop is 17.11x. This represents the PE that might be expected given its specific mix of earnings growth prospects, risk profile, profit margins, industry positioning and market cap. This company specific Fair Ratio is more informative than simple peer or industry comparisons because it adjusts for Walker & Dunlop’s own fundamentals rather than assuming all financials deserve the same multiple. With the current PE of 18.63x sitting modestly above the 17.11x Fair Ratio, the shares appear somewhat expensive on this framework.
Result: OVERVALUED
PE ratios tell one story, but what if the real opportunity lies elsewhere? Discover 1454 companies where insiders are betting big on explosive growth.
Upgrade Your Decision Making: Choose your Walker & Dunlop Narrative
Earlier we mentioned that there is an even better way to understand valuation, so let us introduce you to Narratives, a simple way to turn your view of Walker & Dunlop into a story that connects the business, a financial forecast, and a fair value you can actually act on.
A Narrative on Simply Wall St is your explanation for why the numbers should look a certain way, where you outline how you expect revenue, earnings and margins to evolve, and then see what fair value those assumptions imply.
Because Narratives live inside the Community page on Simply Wall St, they are easy to build, compare and update, and many investors use them to help decide whether a stock’s Fair Value suggests it may be worth holding or avoiding relative to today’s market price.
They also update dynamically as new information arrives, so if Walker & Dunlop posts stronger multifamily growth or faces fresh regulatory risks, the forecasts and fair values linked to each Narrative can shift automatically.
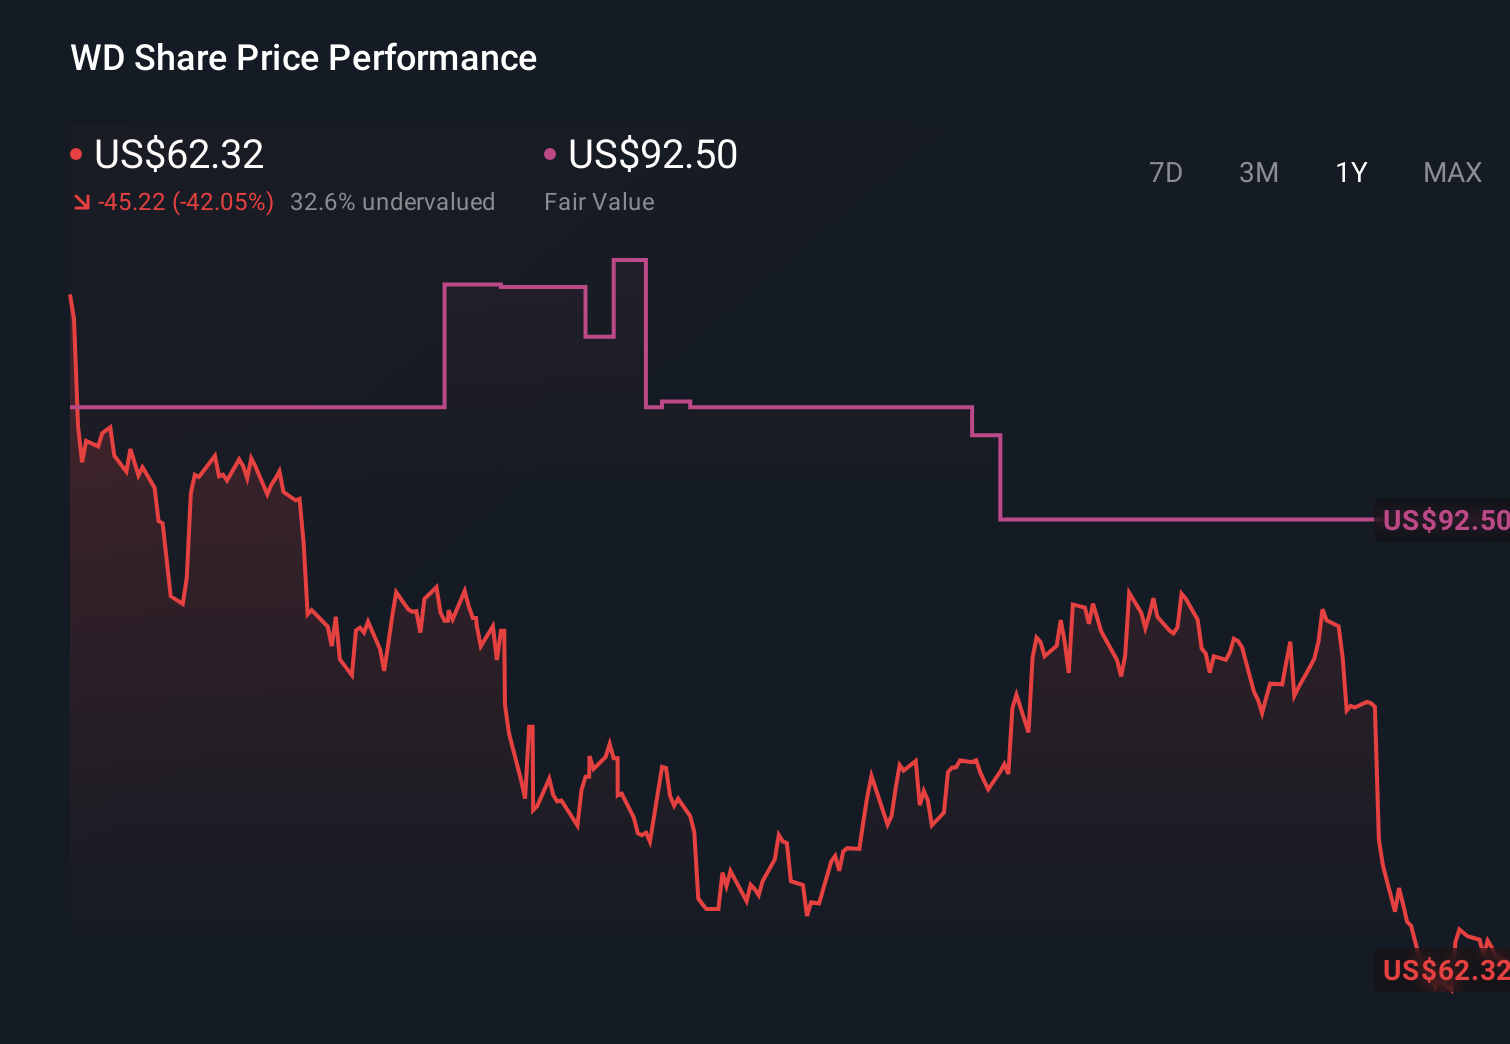
For example, one more optimistic Narrative might project robust loan growth, margin expansion and a fair value above $92.50. In contrast, a more cautious Narrative might assume slower growth, tighter margins and a fair value well below the current price, helping each investor decide which story they find more reasonable and how that fits into their own approach.
Do you think there's more to the story for Walker & Dunlop? Head over to our Community to see what others are saying!
This article by Simply Wall St is general in nature. We provide commentary based on historical data and analyst forecasts only using an unbiased methodology and our articles are not intended to be financial advice. It does not constitute a recommendation to buy or sell any stock, and does not take account of your objectives, or your financial situation. We aim to bring you long-term focused analysis driven by fundamental data. Note that our analysis may not factor in the latest price-sensitive company announcements or qualitative material. Simply Wall St has no position in any stocks mentioned.
Have feedback on this article? Concerned about the content? Get in touch with us directly. Alternatively, email editorial-team@simplywallst.com