
Is There an Opportunity in Workiva After Its Recent Share Price Slump?
- Wondering if Workiva at around $88 is a quietly mispriced opportunity or a value trap in disguise? You are not alone. This stock has been catching the eye of investors looking for quality software names at a discount.
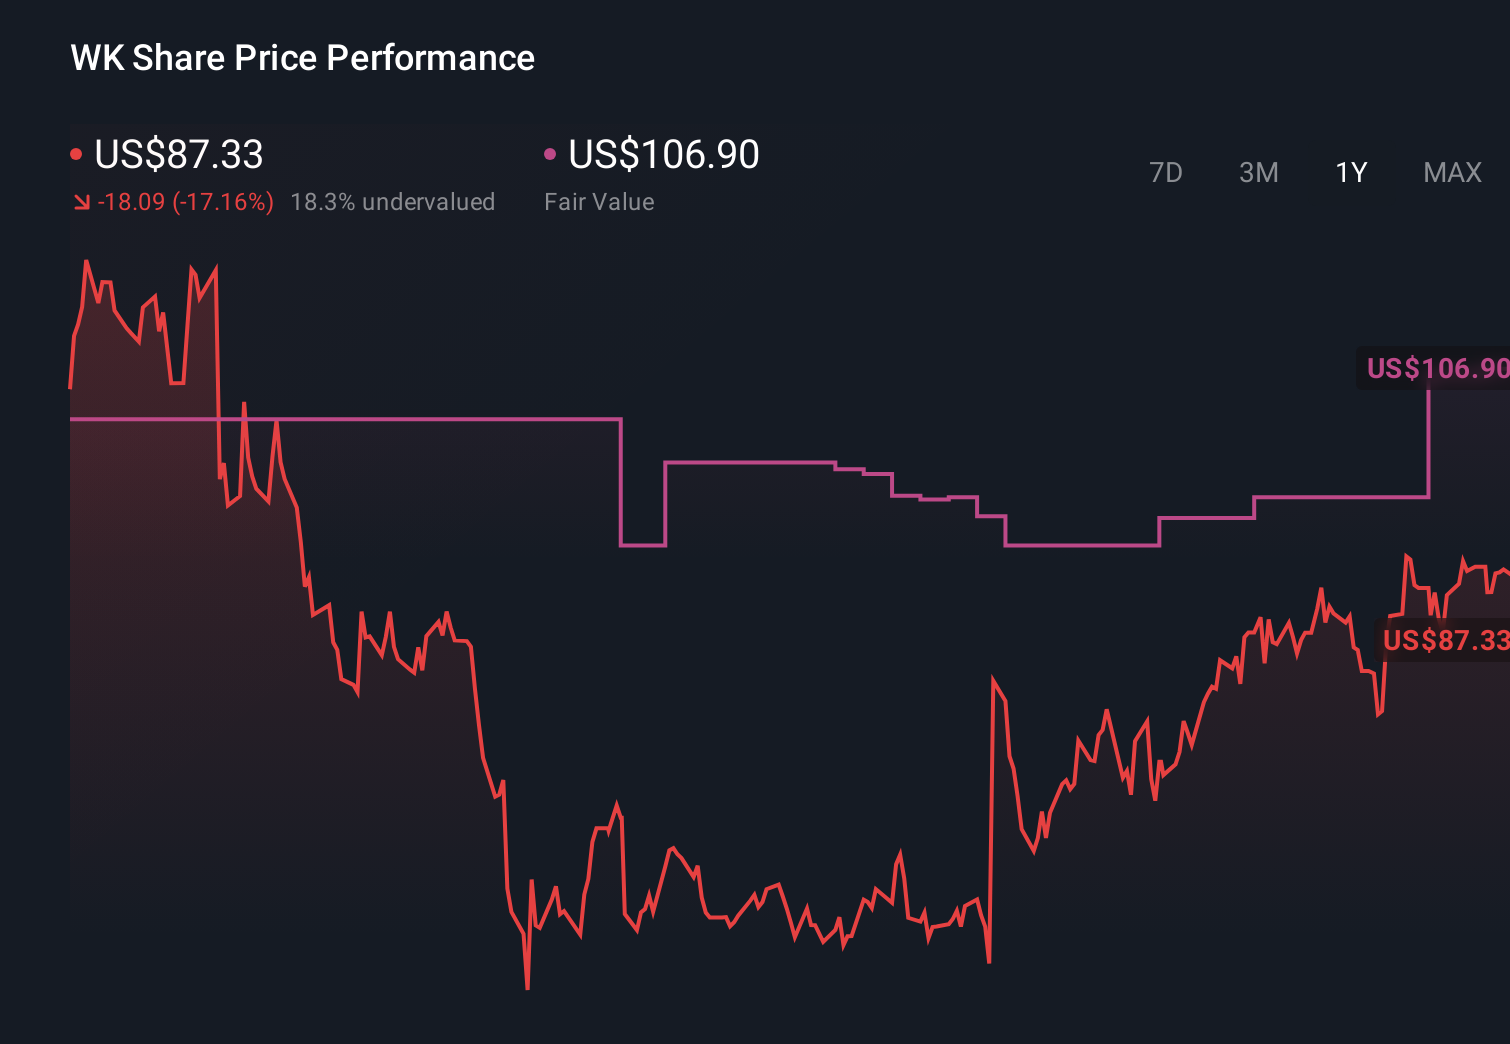
- Despite being down 19.1% year to date and 20.9% over the last year, the share price has stabilized recently, with a 2.7% gain over the past week, even as the 30 day return still sits at a modest -2.9%.
- That mixed performance comes against a backdrop of Workiva steadily expanding its cloud based compliance and reporting platform and continuing to win traction with enterprises navigating complex ESG and regulatory demands. Investors have been weighing that strategic progress against a tougher backdrop for growth oriented software names broadly, contributing to the choppy price action.
- Interestingly, Workiva currently scores a solid 5/6 on our valuation checks, suggesting the market may be underestimating parts of the story. In the next sections we will walk through traditional valuation approaches to see how that stacks up, then finish with a more holistic way to think about what Workiva might really be worth.
Find out why Workiva's -20.9% return over the last year is lagging behind its peers.
Approach 1: Workiva Discounted Cash Flow (DCF) Analysis
A Discounted Cash Flow model estimates what a company is worth by projecting its future cash flows and then discounting them back to today, using a required rate of return. For Workiva, the latest twelve month Free Cash Flow stands at about $130.3 million, providing the starting point for this analysis.
Analysts and extrapolated estimates suggest Workiva’s Free Cash Flow could grow meaningfully over the coming decade, with projections rising from around $148.4 million in 2026 to roughly $625.6 million by 2035. These figures, all in dollars, are discounted back to present value using a 2 Stage Free Cash Flow to Equity model to capture both an initial faster growth phase and a more mature phase later on.
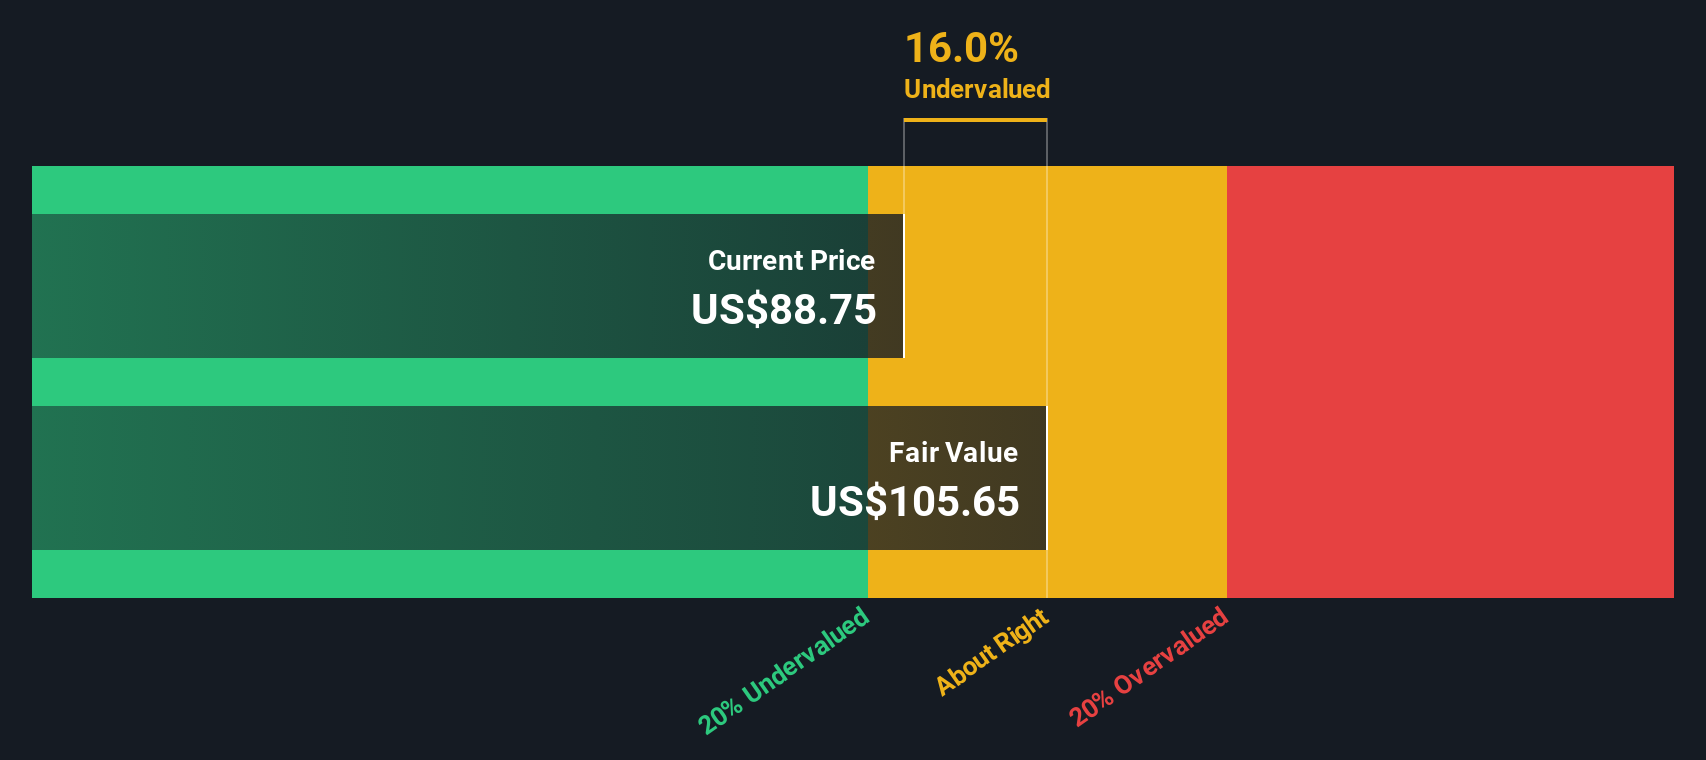
Aggregating these discounted cash flows yields an estimated intrinsic value of about $131.18 per share. Compared with the current share price near $88, the model implies the stock is roughly 32.9% undervalued. This indicates that, based on these projections, the market may be pricing Workiva below the value of its projected cash generation.
Result: UNDERVALUED
Our Discounted Cash Flow (DCF) analysis suggests Workiva is undervalued by 32.9%. Track this in your watchlist or portfolio, or discover 917 more undervalued stocks based on cash flows.
Approach 2: Workiva Price vs Sales
For software businesses like Workiva that are still prioritizing growth and reinvestment, revenue is often a cleaner yardstick than earnings or book value. This makes the price to sales multiple a practical way to compare valuation.
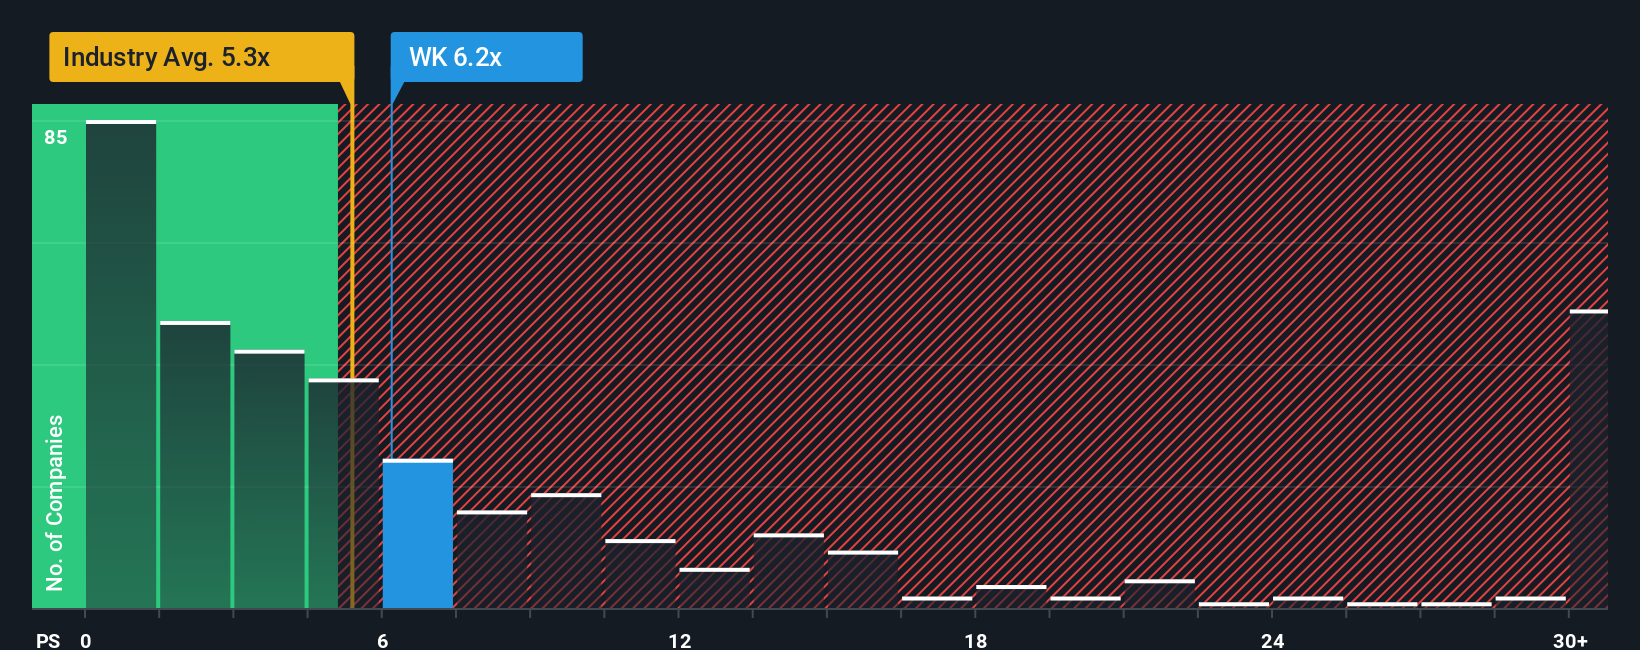
In general, higher growth and lower risk justify a higher sales multiple, while slower growth or greater uncertainty call for a lower one. Workiva currently trades on a price to sales ratio of about 5.85x, which is above the broader software industry average of roughly 4.87x, but a bit below the peer group average near 6.35x. This suggests the market is already assigning it a modest quality and growth premium.
Simply Wall St’s proprietary Fair Ratio for Workiva comes in at around 6.20x. This reflects what investors might reasonably pay given its specific mix of expected growth, profitability profile, risk factors, market cap and software industry positioning. Because this Fair Ratio is tailored to the company rather than being a blunt comparison to peers or the sector, it offers a more nuanced anchor for valuation. With the current 5.85x multiple sitting below the 6.20x Fair Ratio, Workiva screens as modestly undervalued on this lens.
Result: UNDERVALUED
PS ratios tell one story, but what if the real opportunity lies elsewhere? Discover 1456 companies where insiders are betting big on explosive growth.
Upgrade Your Decision Making: Choose your Workiva Narrative
Earlier we mentioned that there is an even better way to understand valuation. Let us introduce you to Narratives, which are simple stories that link your view of Workiva’s future (its revenue growth, margins and risks) to a financial forecast and then to a Fair Value estimate that you can easily compare with today’s share price to decide whether to buy, hold or sell.
On Simply Wall St’s Community page, millions of investors use Narratives as a straightforward tool to write down their assumptions, see how those assumptions translate into future earnings and cash flows, and automatically update their Fair Value when new information, like earnings results or major news, comes in.
For example, one Workiva Narrative might assume strong execution on large enterprise contracts, AI enhanced products and governance reforms that justify a Fair Value around $106.90 per share. A more cautious Narrative might focus on regulatory and macro risks and arrive closer to the low analyst target near $85, showing how two rational investors can look at the same company and reach very different yet clearly quantified conclusions.
Do you think there's more to the story for Workiva? Head over to our Community to see what others are saying!
This article by Simply Wall St is general in nature. We provide commentary based on historical data and analyst forecasts only using an unbiased methodology and our articles are not intended to be financial advice. It does not constitute a recommendation to buy or sell any stock, and does not take account of your objectives, or your financial situation. We aim to bring you long-term focused analysis driven by fundamental data. Note that our analysis may not factor in the latest price-sensitive company announcements or qualitative material. Simply Wall St has no position in any stocks mentioned.
Have feedback on this article? Concerned about the content? Get in touch with us directly. Alternatively, email editorial-team@simplywallst.com