
Does Molina Healthcare’s Recent 15% Rebound Signal a Compelling 2025 Value Opportunity?
- If you are wondering whether Molina Healthcare is quietly turning into a value opportunity after a rough stretch, this breakdown will help you decide if the stock now offers more upside than its recent history suggests.
- The share price has bounced about 15.3% over the last month, although it is still down sharply at around 44.5% over the past year and more than 50% over three years. That combination often signals shifting expectations around risk and recovery potential.
- That recent move has come alongside ongoing policy debates around Medicaid redeterminations and managed care reimbursements, as investors reassess which insurers are positioned to navigate tighter funding and enrollment scrutiny. Molina has also stayed active in winning and renewing state Medicaid contracts, reinforcing its role as a key player in government sponsored healthcare coverage even as sentiment has swung back and forth.
- On our framework, Molina earns a 5/6 valuation score, indicating it screens as undervalued on most of the checks we run. Next, we will unpack what that means across different valuation approaches, before finishing with a more nuanced way to think about what the market might be missing.
Find out why Molina Healthcare's -44.5% return over the last year is lagging behind its peers.
Approach 1: Molina Healthcare Discounted Cash Flow (DCF) Analysis
A Discounted Cash Flow, or DCF, model estimates what a business is worth today by projecting its future cash flows and then discounting those projections back to their value in today’s dollars. For Molina Healthcare, the model used is a 2 Stage Free Cash Flow to Equity approach, built on cash flow projections in $.
Despite reporting last twelve month free cash flow of roughly negative $573 million, analysts expect a sharp swing into positive territory, with free cash flow projected to reach about $1.23 billion by 2029. Beyond the first few analyst covered years, Simply Wall St extrapolates the trajectory out to 10 years, with annual free cash flow estimates generally rising through 2035 as Molina scales its government sponsored healthcare operations.
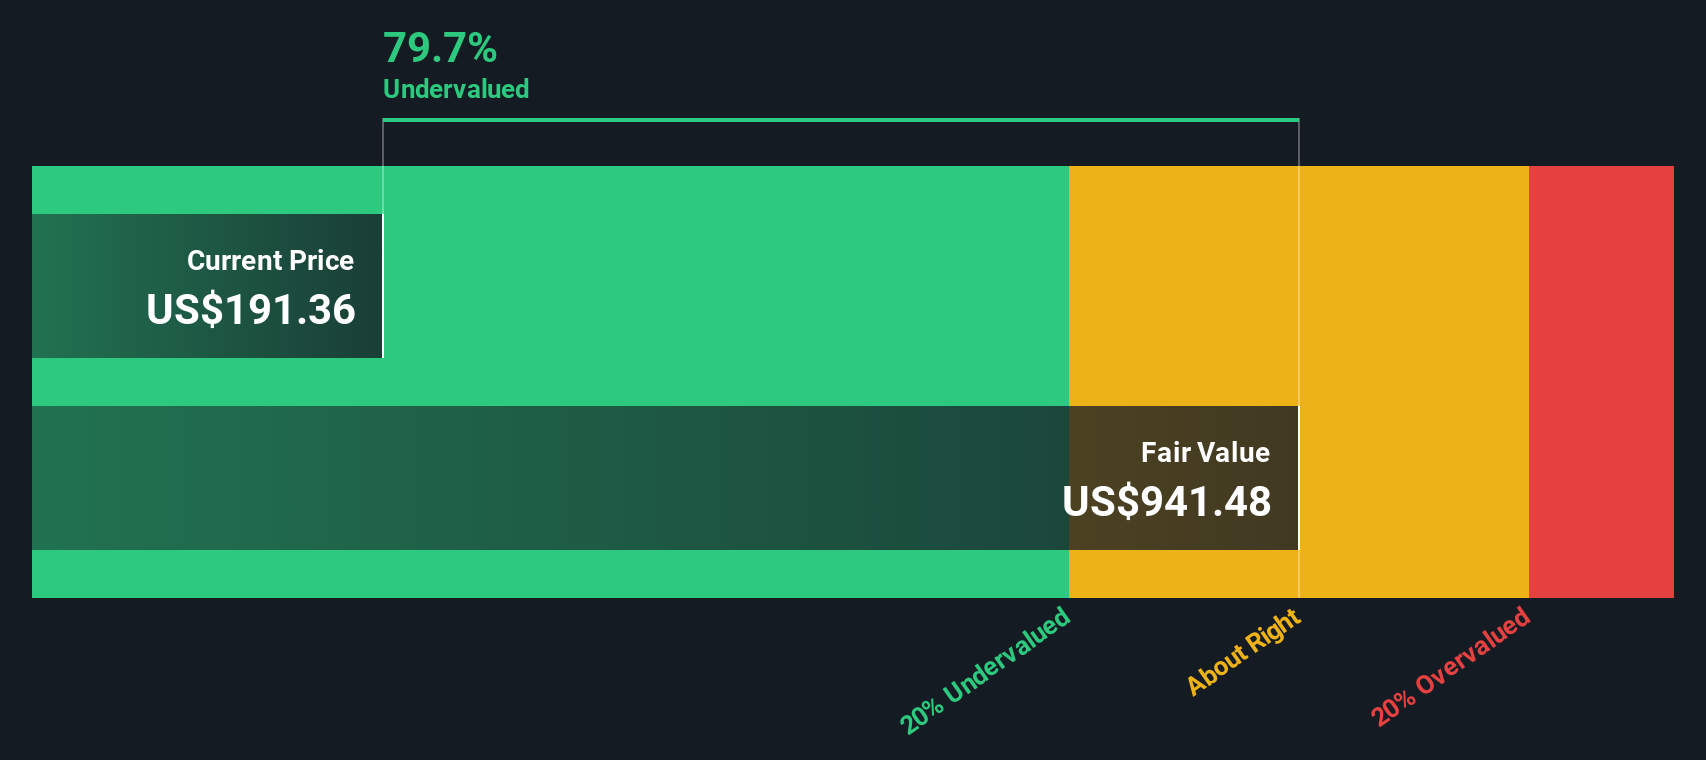
Aggregating and discounting these projected cash flows results in an estimated intrinsic value of about $649 per share. Compared with the current market price, this implies the stock is trading at roughly a 74.9% discount to its DCF based fair value. This suggests investors are heavily discounting Molina’s long term cash generation potential.
Result: UNDERVALUED
Our Discounted Cash Flow (DCF) analysis suggests Molina Healthcare is undervalued by 74.9%. Track this in your watchlist or portfolio, or discover 917 more undervalued stocks based on cash flows.
Approach 2: Molina Healthcare Price vs Earnings
For a consistently profitable insurer like Molina Healthcare, the price to earnings, or PE, ratio is a practical way to gauge how much investors are willing to pay for each dollar of current earnings. In general, faster growing, lower risk companies deserve higher PE multiples, while slower growth or higher uncertainty usually warrant a discount.
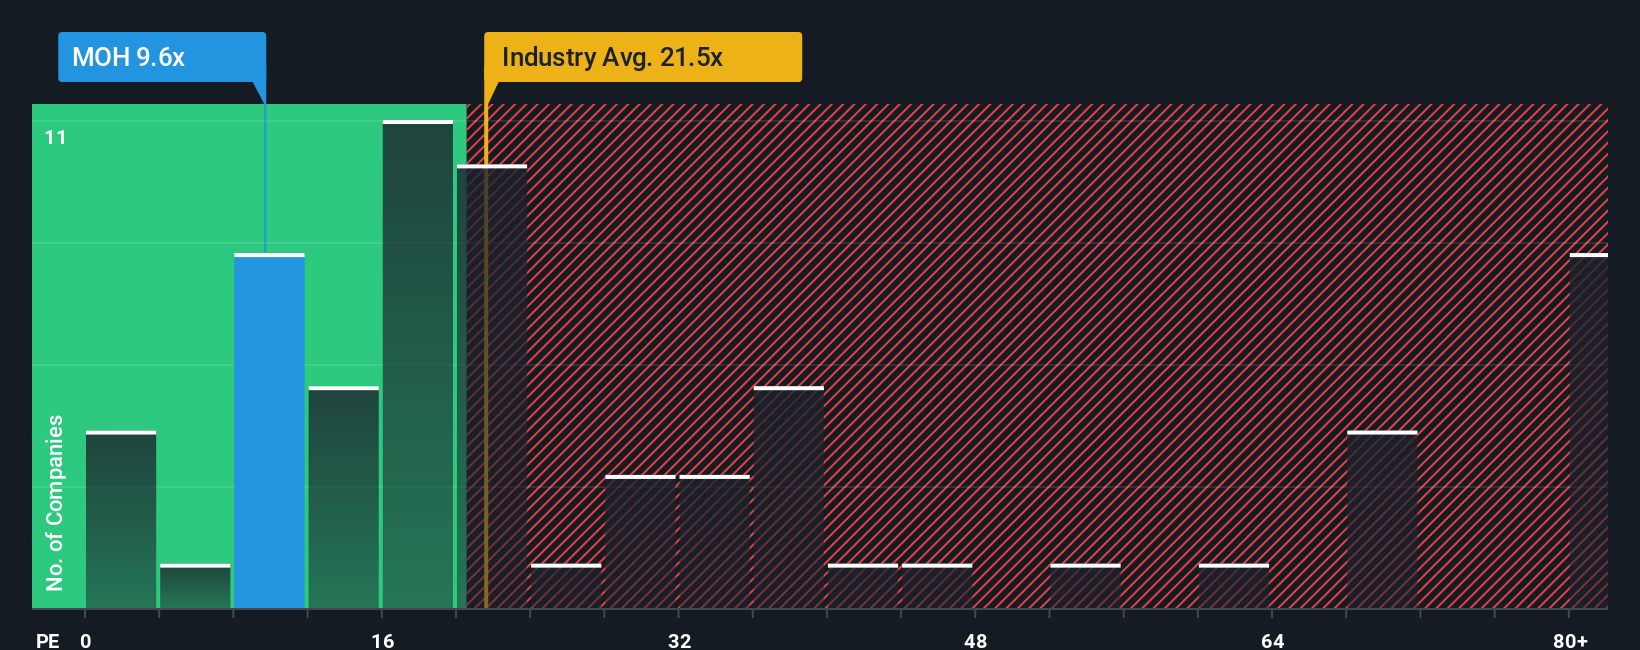
Molina currently trades on roughly 9.48x earnings, which is well below both the broader Healthcare industry average of about 23.56x and a peer group average near 30.13x. Simply Wall St also calculates a proprietary Fair Ratio of around 22.66x for Molina, which is the PE that might be expected given its specific mix of earnings growth, margins, size and risk profile. This Fair Ratio is more tailored than a simple comparison to peers or the sector because it explicitly adjusts for the company’s own fundamentals rather than assuming it should look like an average insurer.
Stacking these numbers up, Molina’s actual PE of 9.48x sits far below its Fair Ratio of 22.66x. This points to a meaningful valuation gap that suggests the market is pricing in more risk or weaker growth than the fundamentals imply.
Result: UNDERVALUED
PE ratios tell one story, but what if the real opportunity lies elsewhere? Discover 1456 companies where insiders are betting big on explosive growth.
Upgrade Your Decision Making: Choose your Molina Healthcare Narrative
Earlier we mentioned that there is an even better way to understand valuation, so let us introduce you to Narratives, which are simple, investor created stories that link your view of Molina Healthcare’s business to a concrete financial forecast and, ultimately, a fair value estimate. On Simply Wall St’s Community page, millions of investors use Narratives to spell out their assumptions for future revenue, earnings and margins, and the platform then turns those inputs into a dynamic fair value that can be compared directly with today’s share price to help decide whether to buy, hold or sell. Because Narratives automatically refresh when new information arrives, such as earnings surprises, contract wins or Medicaid policy headlines, they stay relevant as the story evolves. For instance, one Molina Narrative might assume that recent contract wins and disciplined cost control justify a fair value close to the most bullish analyst target of about $330. In contrast, a more cautious Narrative, focused on Medicaid funding risk and medical cost pressure, might anchor around the low end near $153, giving you a clear, story driven range to interpret against the current price.
Do you think there's more to the story for Molina Healthcare? Head over to our Community to see what others are saying!

This article by Simply Wall St is general in nature. We provide commentary based on historical data and analyst forecasts only using an unbiased methodology and our articles are not intended to be financial advice. It does not constitute a recommendation to buy or sell any stock, and does not take account of your objectives, or your financial situation. We aim to bring you long-term focused analysis driven by fundamental data. Note that our analysis may not factor in the latest price-sensitive company announcements or qualitative material. Simply Wall St has no position in any stocks mentioned.
Have feedback on this article? Concerned about the content? Get in touch with us directly. Alternatively, email editorial-team@simplywallst.com