
Flagstar Bank (FLG): Rethinking Valuation After Its Private Banking and Wealth Expansion Push
Flagstar Bank National Association (FLG) just doubled down on its private banking ambitions by rolling out new wealth planning units and a regional operating model that tie directly into its recent share price momentum.
See our latest analysis for Flagstar Bank National Association.
Those wealth build outs seem to be resonating with investors, with a roughly 25 percent 1 month share price return and about 46 percent year to date, even though the 3 year total shareholder return is still deeply negative. This suggests momentum is rebuilding from a low base.
If you like the idea of banks repositioning for growth, it is worth exploring other financial names with strong fundamentals and insider alignment through fast growing stocks with high insider ownership.
With the stock up sharply this year but trading only slightly below analyst targets and still carrying recent losses, is Flagstar an underappreciated turnaround, or has the market already baked in its private banking growth story?
Price to Book of 0.7x: Is it justified?
Flagstar Bank National Association currently trades at a price to book ratio of around 0.7 times, which appears inexpensive compared with both peers and the wider US banks sector.
Price to book compares the market value of the bank to its net assets on the balance sheet. This is a key yardstick for capital intensive, asset based businesses like banks, where loan quality and equity buffers influence long term resilience and returns.
In Flagstar's case, the low multiple suggests investors are still discounting its recent losses and elevated bad loan levels, even though revenue growth is expected to outpace the broader US market and the bank is forecast to return to profitability over the next three years.
Compared with the closest peer set average of 1.3 times and the broader US banks industry at 1.1 times, Flagstar's 0.7 times price to book highlights a clear valuation gap that indicates the market assigns a sizable penalty for its current unprofitability and high bad loan ratio.
See what the numbers say about this price — find out in our valuation breakdown.
Result: Price-to-book of 0.7x (UNDERVALUED)
However, significant recent losses and elevated bad loans mean any setback in the private banking buildout or credit quality could quickly unwind the emerging optimism.
Find out about the key risks to this Flagstar Bank National Association narrative.
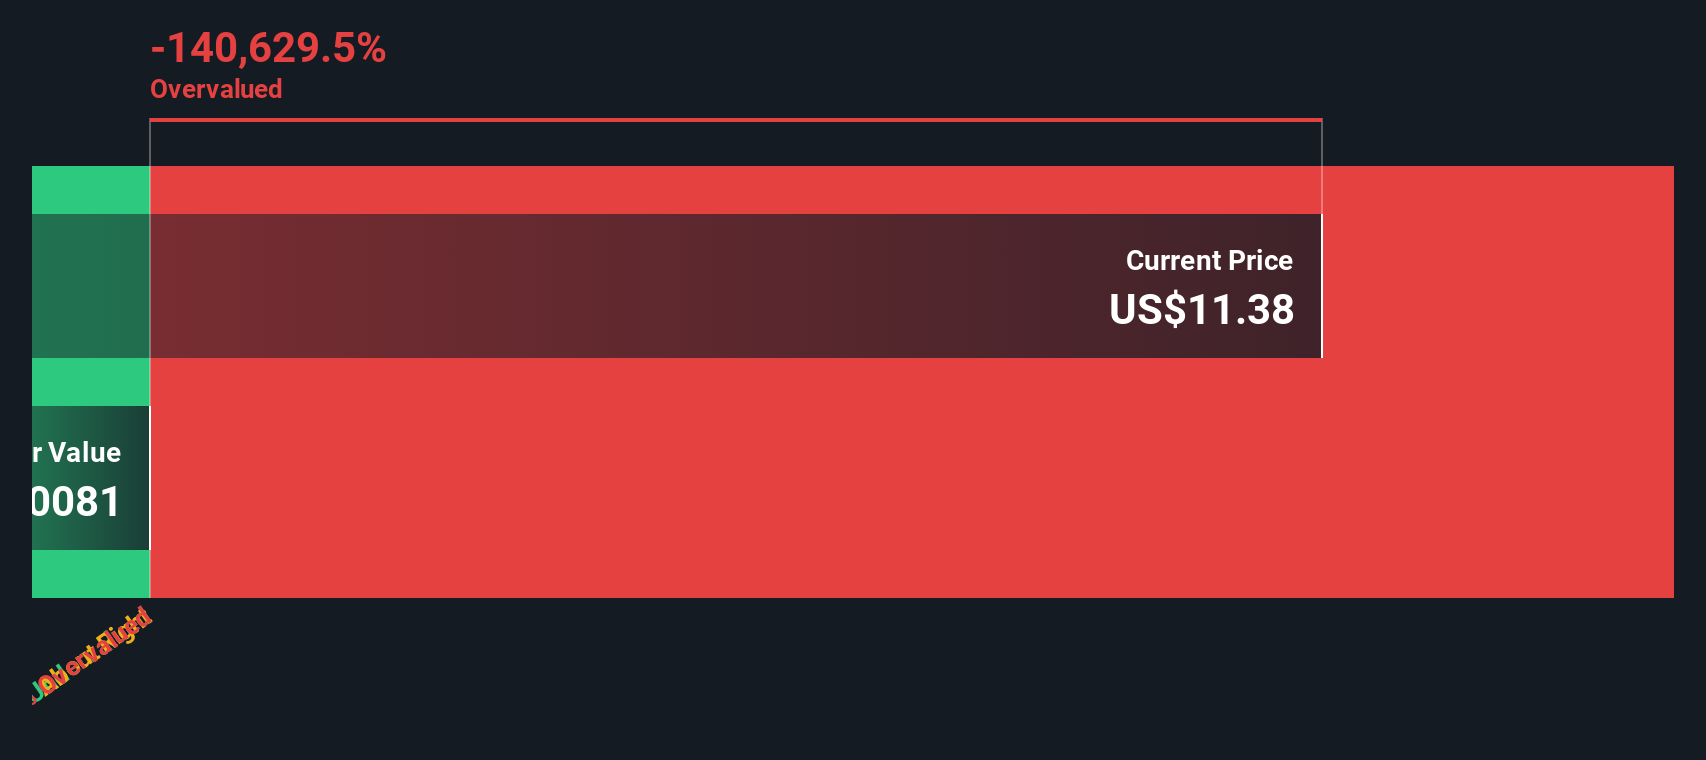
Another View: Our DCF Model Sees Risk, Not Bargain
While the low price to book hints at value, our DCF model tells a different story, suggesting Flagstar is trading well above its estimated fair value. If the cash flow path disappoints, today’s apparent discount on assets could instead become a value trap.
Look into how the SWS DCF model arrives at its fair value.
Simply Wall St performs a discounted cash flow (DCF) on every stock in the world every day (check out Flagstar Bank National Association for example). We show the entire calculation in full. You can track the result in your watchlist or portfolio and be alerted when this changes, or use our stock screener to discover 916 undervalued stocks based on their cash flows. If you save a screener we even alert you when new companies match - so you never miss a potential opportunity.
Build Your Own Flagstar Bank National Association Narrative
If you see the story differently or want to dig into the numbers yourself, you can assemble a personalized view in just minutes: Do it your way.
A great starting point for your Flagstar Bank National Association research is our analysis highlighting 1 key reward and 2 important warning signs that could impact your investment decision.
Ready for your next investing edge?
Flagstar might be on your radar now, but do not stop there. The right screen could surface your next high conviction winner before everyone else notices.
- Capture potential mispricings by running through these 916 undervalued stocks based on cash flows that spotlight companies trading below what their cash flows may truly be worth.
- Ride structural growth trends by using these 29 healthcare AI stocks to zero in on businesses fusing medicine with advanced algorithms.
- Turn volatility into opportunity by scanning these 80 cryptocurrency and blockchain stocks for stocks positioned to benefit from blockchain and digital asset adoption.
This article by Simply Wall St is general in nature. We provide commentary based on historical data and analyst forecasts only using an unbiased methodology and our articles are not intended to be financial advice. It does not constitute a recommendation to buy or sell any stock, and does not take account of your objectives, or your financial situation. We aim to bring you long-term focused analysis driven by fundamental data. Note that our analysis may not factor in the latest price-sensitive company announcements or qualitative material. Simply Wall St has no position in any stocks mentioned.
Have feedback on this article? Concerned about the content? Get in touch with us directly. Alternatively, email editorial-team@simplywallst.com