
Assessing Palvella Therapeutics After Its 666.8% Surge and Late Stage Pipeline Progress
- Wondering if Palvella Therapeutics is still a smart buy after its massive run up, or if the market has already priced in the story, you are not alone. That is exactly what this breakdown will tackle.
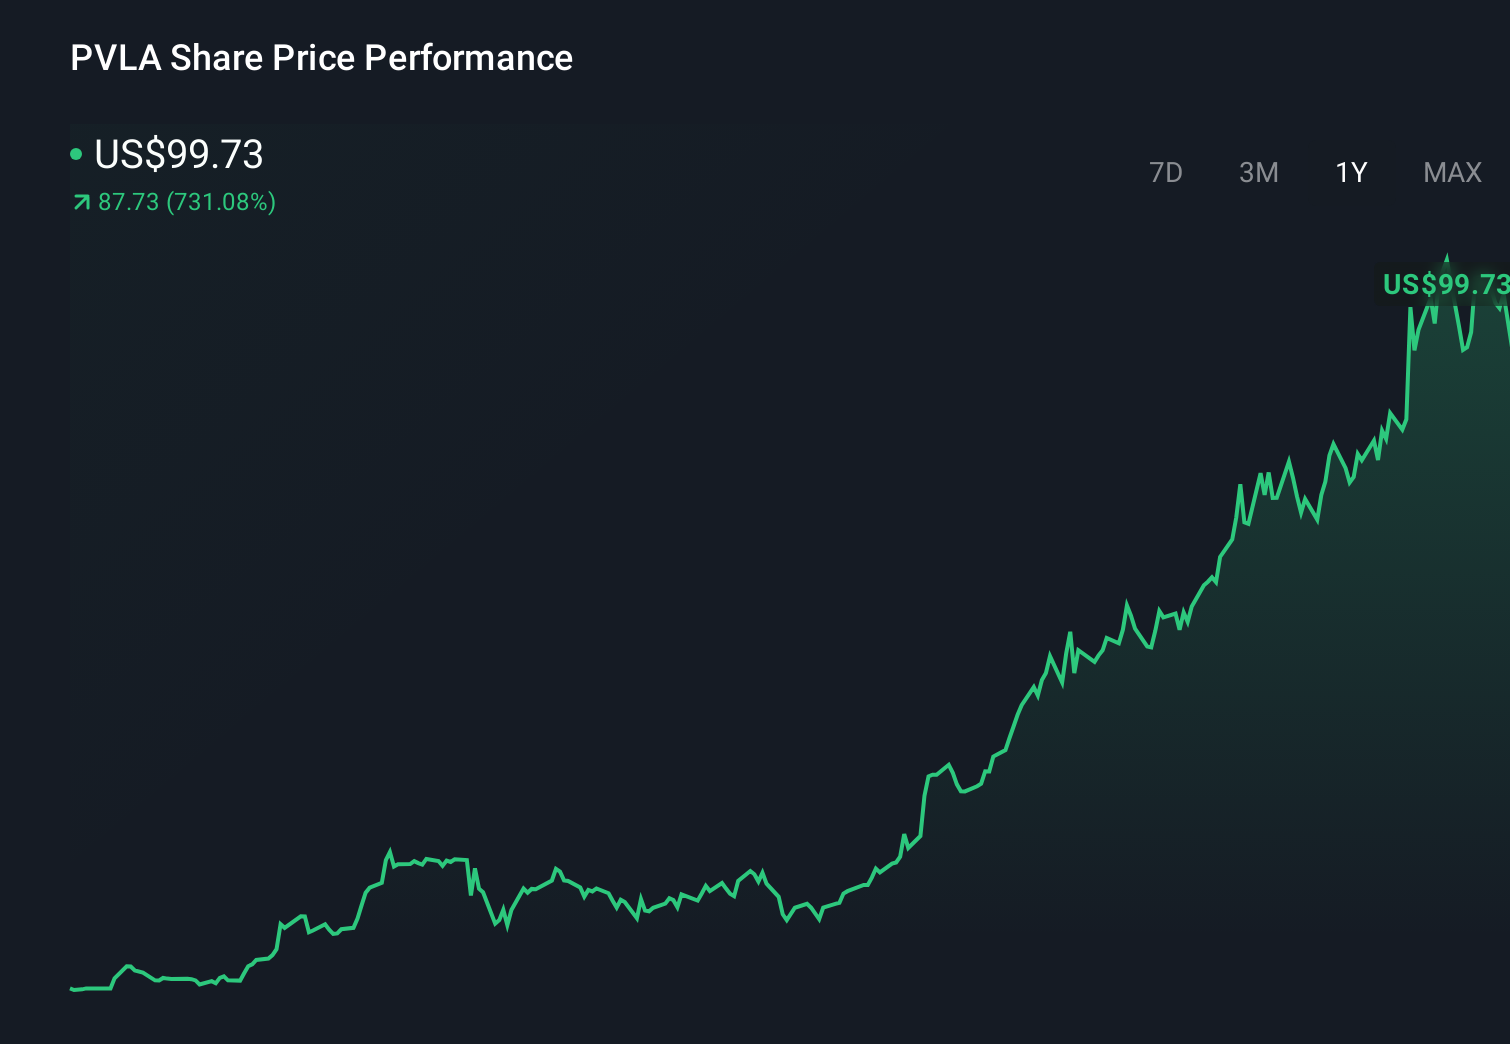
- After an eye catching 666.8% return year to date, the stock has cooled slightly in the last week with a 4.9% pullback but is still up 10.9% over the past month.
- Recent headlines have focused on Palvella's progress in late stage development for treatments targeting rare dermatologic diseases. This has sharpened investor attention on its long term revenue potential. At the same time, coverage has increasingly framed the company as a high risk, high reward biotech story, helping explain the sharp share price swings.
- On our valuation framework Palvella scores a 3 out of 6, suggesting it may still offer upside on some metrics. Next we will unpack those different valuation approaches before finishing with a more holistic way to think about what the stock is really worth.
Approach 1: Palvella Therapeutics Discounted Cash Flow (DCF) Analysis
A Discounted Cash Flow model estimates what a company is worth today by projecting its future cash flows and then discounting those back to a present value in $.
For Palvella Therapeutics, the latest twelve month Free Cash Flow is roughly -$25.5 million, reflecting its current investment heavy, pre commercial phase. Analysts expect cash flows to stay negative near term, with projections of around -$43.9 million in 2026 and -$78.1 million in 2027, before turning positive. By 2029, Free Cash Flow is forecast to improve to about $36.7 million, with Simply Wall St extrapolations increasing this further over the following years as products scale.
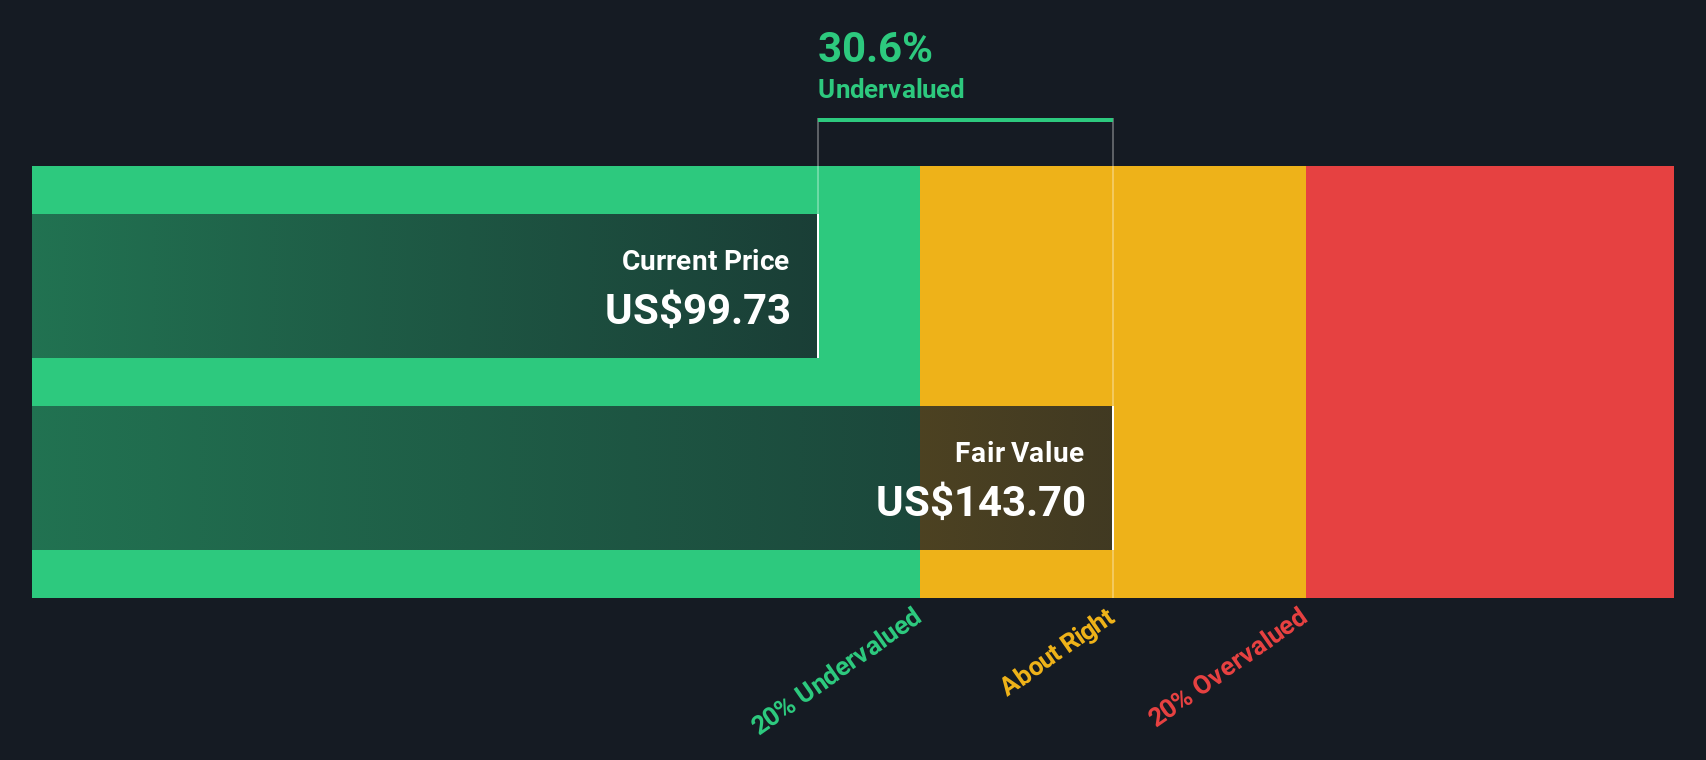
Using these cash flow forecasts in a 2 Stage Free Cash Flow to Equity model, the intrinsic value for Palvella is estimated at about $143.17 per share. This suggests the stock is trading at roughly a 35.7% discount to its DCF fair value, which indicates potential upside if the cash flow trajectory develops as expected.
Result: UNDERVALUED
Our Discounted Cash Flow (DCF) analysis suggests Palvella Therapeutics is undervalued by 35.7%. Track this in your watchlist or portfolio, or discover 916 more undervalued stocks based on cash flows.
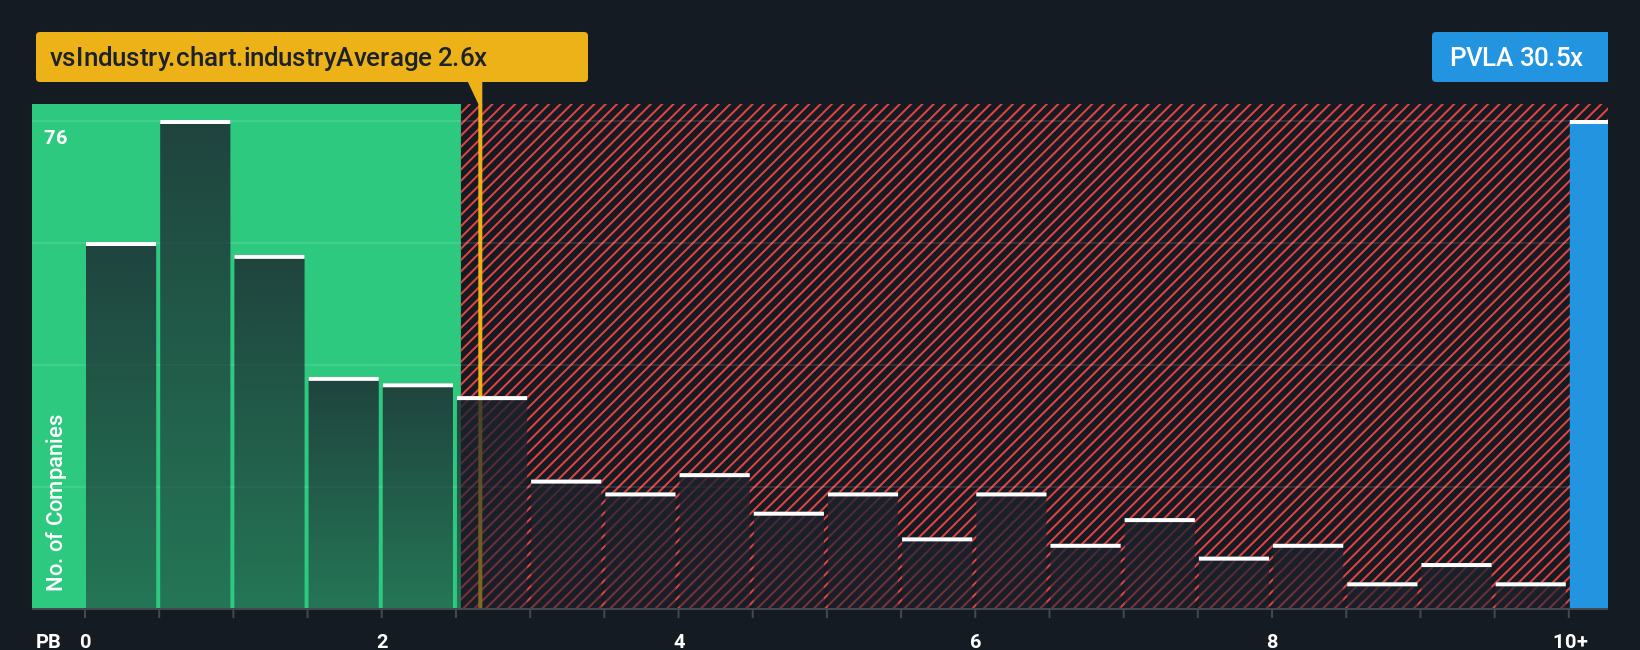
Approach 2: Palvella Therapeutics Price vs Book
For companies that are still loss making but asset heavy, the price to book ratio is often a more practical yardstick than earnings based metrics because it compares the market value directly with the net assets backing the business. In general, investors are willing to pay a higher multiple of book value when they expect stronger growth and see lower risk. Slower growth or higher uncertainty usually justifies a lower, more conservative multiple.
Palvella currently trades on a price to book ratio of about 28.2x, which is far above the wider Biotechs industry average of roughly 2.6x and also meaningfully higher than the peer group average of around 10.5x. Simply Wall St’s Fair Ratio framework estimates what a more appropriate multiple should be by blending in factors like Palvella’s expected growth, profitability profile, risk, industry positioning and market cap rather than relying only on blunt comparisons with peers. On this more tailored view, Palvella’s current price to book multiple sits well above its Fair Ratio. On this metric, the stock is pricing in very optimistic assumptions.
Result: OVERVALUED
PB ratios tell one story, but what if the real opportunity lies elsewhere? Discover 1455 companies where insiders are betting big on explosive growth.
Upgrade Your Decision Making: Choose your Palvella Therapeutics Narrative
Earlier we mentioned that there is an even better way to understand valuation, so let us introduce you to Narratives, a simple way to put your own story about a company alongside the numbers, such as your assumptions for fair value, future revenue, earnings and margins. A Narrative connects three things: what you believe about the business, how that belief translates into a financial forecast, and what fair value that forecast implies. On Simply Wall St, Narratives sit inside the Community page and are used by millions of investors as an easy, accessible tool to frame decisions about when to buy or sell, by comparing each user’s Fair Value to the current market Price. Because they are linked to live data, Narratives update dynamically as new information arrives, like trial results, regulatory decisions or earnings reports. For Palvella Therapeutics, one investor’s Narrative might assume rapid adoption of its lead therapy and a high fair value, while another assumes slower uptake, higher risk and a much lower fair value, leading to very different conclusions about whether today’s price is attractive.
Do you think there's more to the story for Palvella Therapeutics? Head over to our Community to see what others are saying!
This article by Simply Wall St is general in nature. We provide commentary based on historical data and analyst forecasts only using an unbiased methodology and our articles are not intended to be financial advice. It does not constitute a recommendation to buy or sell any stock, and does not take account of your objectives, or your financial situation. We aim to bring you long-term focused analysis driven by fundamental data. Note that our analysis may not factor in the latest price-sensitive company announcements or qualitative material. Simply Wall St has no position in any stocks mentioned.
Have feedback on this article? Concerned about the content? Get in touch with us directly. Alternatively, email editorial-team@simplywallst.com