
Is Hancock Whitney Still Attractively Priced After Its 120% Five Year Share Price Surge?
- If you are wondering whether Hancock Whitney is still reasonably priced after its run, you are not alone. This stock has quietly turned into one that valuation focused investors can no longer ignore.
- Over the last month the share price has climbed 15.9%, contributing to a 24.9% gain over the past year and a 120.1% rise over five years. Moves like this can signal both growing optimism and a shift in how the market views its risk profile.
- Recent headlines around regional banks, including tighter regulatory scrutiny and shifting deposit trends, have put the whole sector back under the microscope. At the same time, investors have been paying closer attention to balance sheet quality and capital strength at institutions like Hancock Whitney, which helps explain some of the renewed interest in the stock.
- On our valuation framework Hancock Whitney scores a 4 out of 6 for being undervalued. You can see the full breakdown of that score here. In the rest of this article we will unpack what that really means across different valuation methods and finish by looking at a more nuanced way to think about the company’s value.
Find out why Hancock Whitney's 24.9% return over the last year is lagging behind its peers.
Approach 1: Hancock Whitney Excess Returns Analysis
The Excess Returns model looks at how much value Hancock Whitney creates over and above the minimum return shareholders require, rather than just projecting cash flows. It starts from the balance sheet and earnings power, then estimates how long the bank can earn attractive returns on its equity base.
For Hancock Whitney, the model assumes a Book Value of $52.82 per share and Stable EPS of $6.35 per share, based on weighted future Return on Equity estimates from 7 analysts. With a Cost of Equity of $4.08 per share, the bank is expected to generate an Excess Return of $2.27 per share, supported by an Average Return on Equity of 10.89%. That return profile is anchored by a Stable Book Value of $58.29 per share, again derived from analyst forecasts.
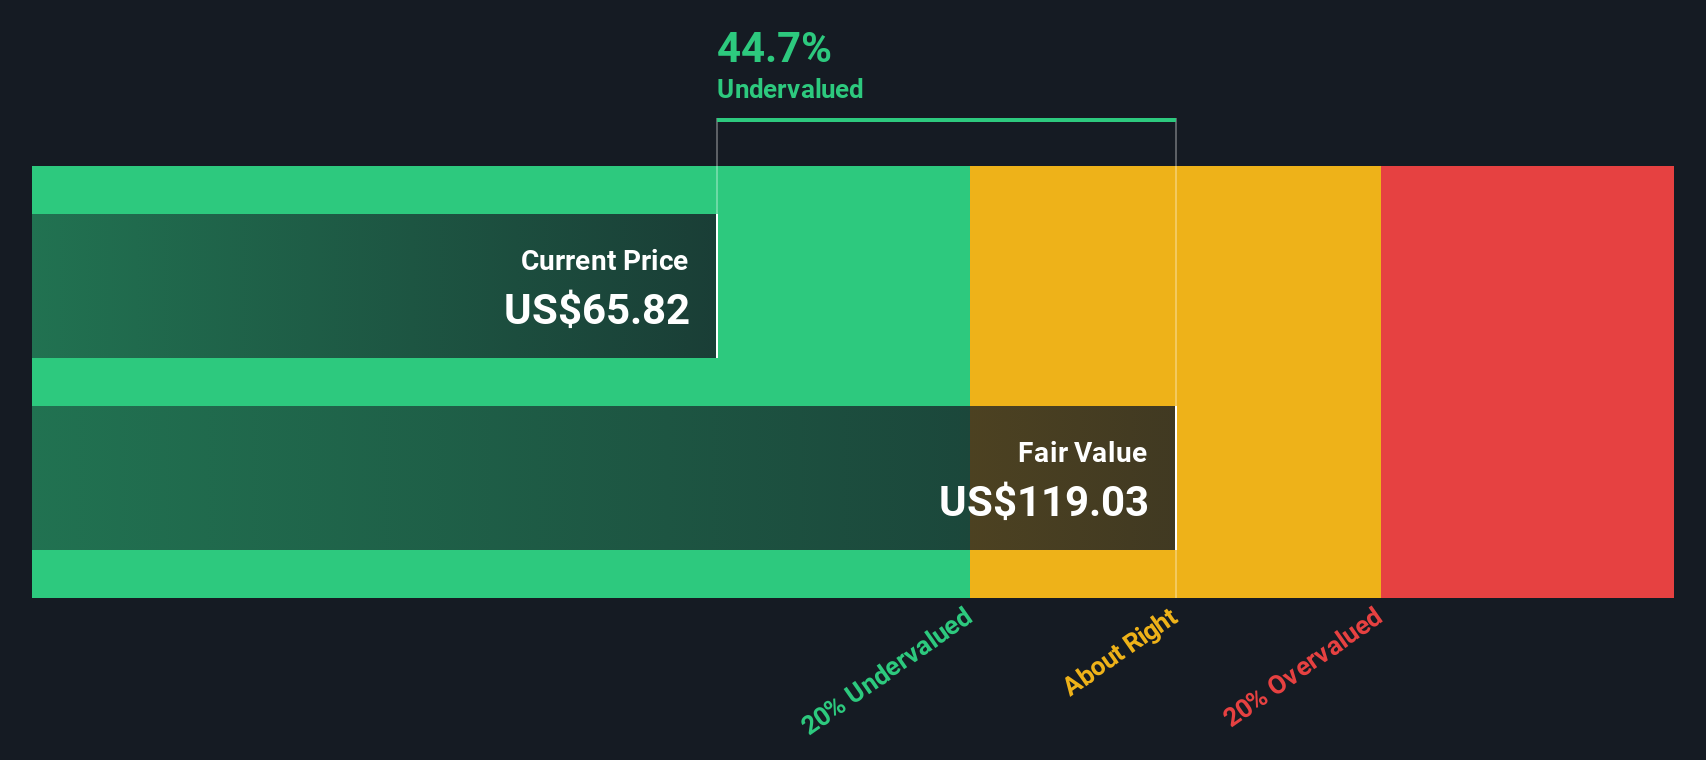
Feeding these inputs into the Excess Returns framework gives an intrinsic value estimate of about $118.99 per share, suggesting the stock is roughly 44.6% undervalued versus its current market price. In other words, the market is not fully pricing in Hancock Whitney's ability to earn returns above its cost of equity.
Result: UNDERVALUED
Our Excess Returns analysis suggests Hancock Whitney is undervalued by 44.6%. Track this in your watchlist or portfolio, or discover 917 more undervalued stocks based on cash flows.
Approach 2: Hancock Whitney Price vs Earnings
For a consistently profitable bank like Hancock Whitney, the price to earnings (PE) ratio is a straightforward way to gauge how much investors are paying for each dollar of current earnings. In general, faster growing and lower risk banks tend to justify higher PE ratios, while slower growth or higher perceived risk should translate into a lower, more conservative multiple.
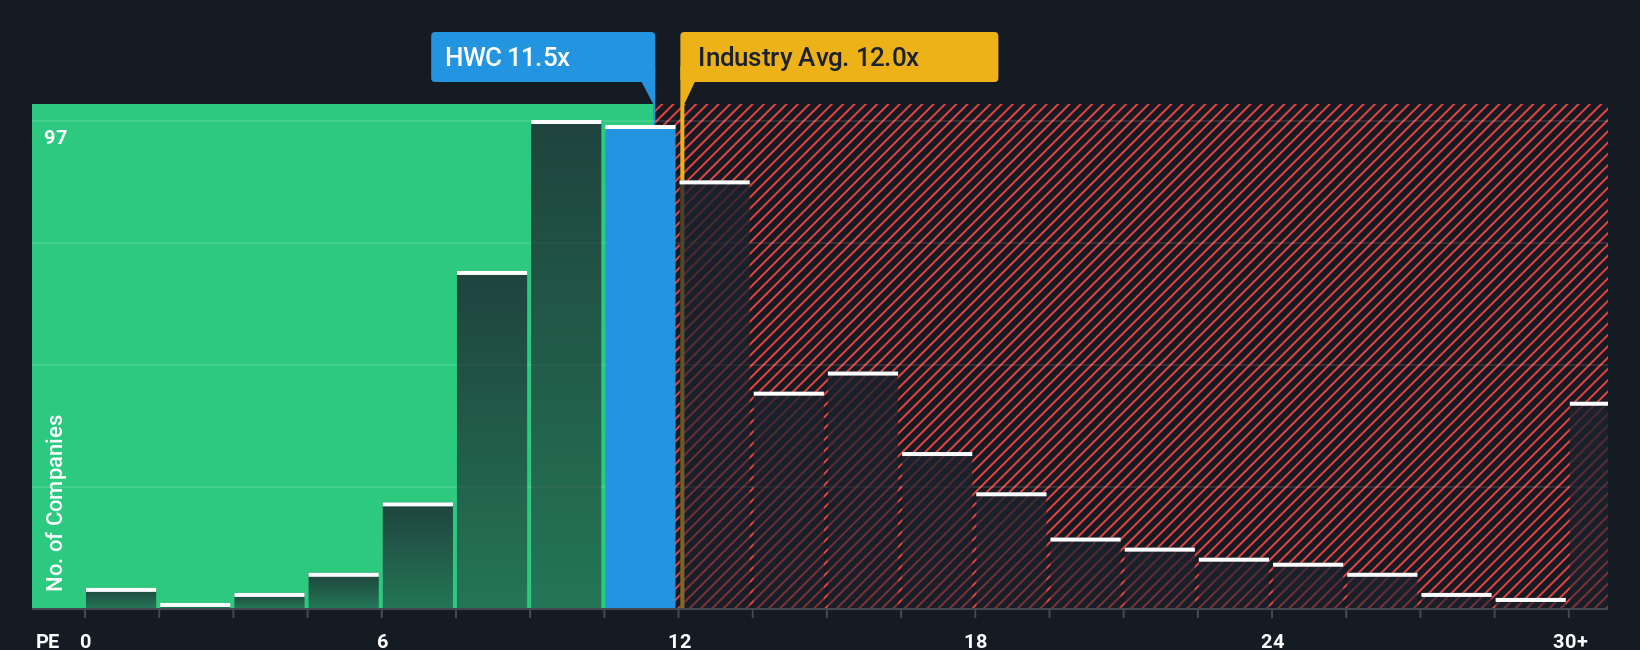
Hancock Whitney currently trades on a PE of about 11.47x, which is slightly below the broader Banks industry average of around 12.02x and well below the peer group average of roughly 16.58x. Simply Wall St’s proprietary Fair Ratio for Hancock Whitney is 11.46x, which is the PE you would expect given its specific earnings growth outlook, profitability, size, industry positioning and risk profile. This makes it a more tailored benchmark than a simple comparison with sector averages that may include very different banks.
Because Hancock Whitney’s actual PE of 11.47x is almost identical to the Fair Ratio of 11.46x, the shares look fairly valued on this earnings based lens.
Result: ABOUT RIGHT
PE ratios tell one story, but what if the real opportunity lies elsewhere? Discover 1455 companies where insiders are betting big on explosive growth.
Upgrade Your Decision Making: Choose your Hancock Whitney Narrative
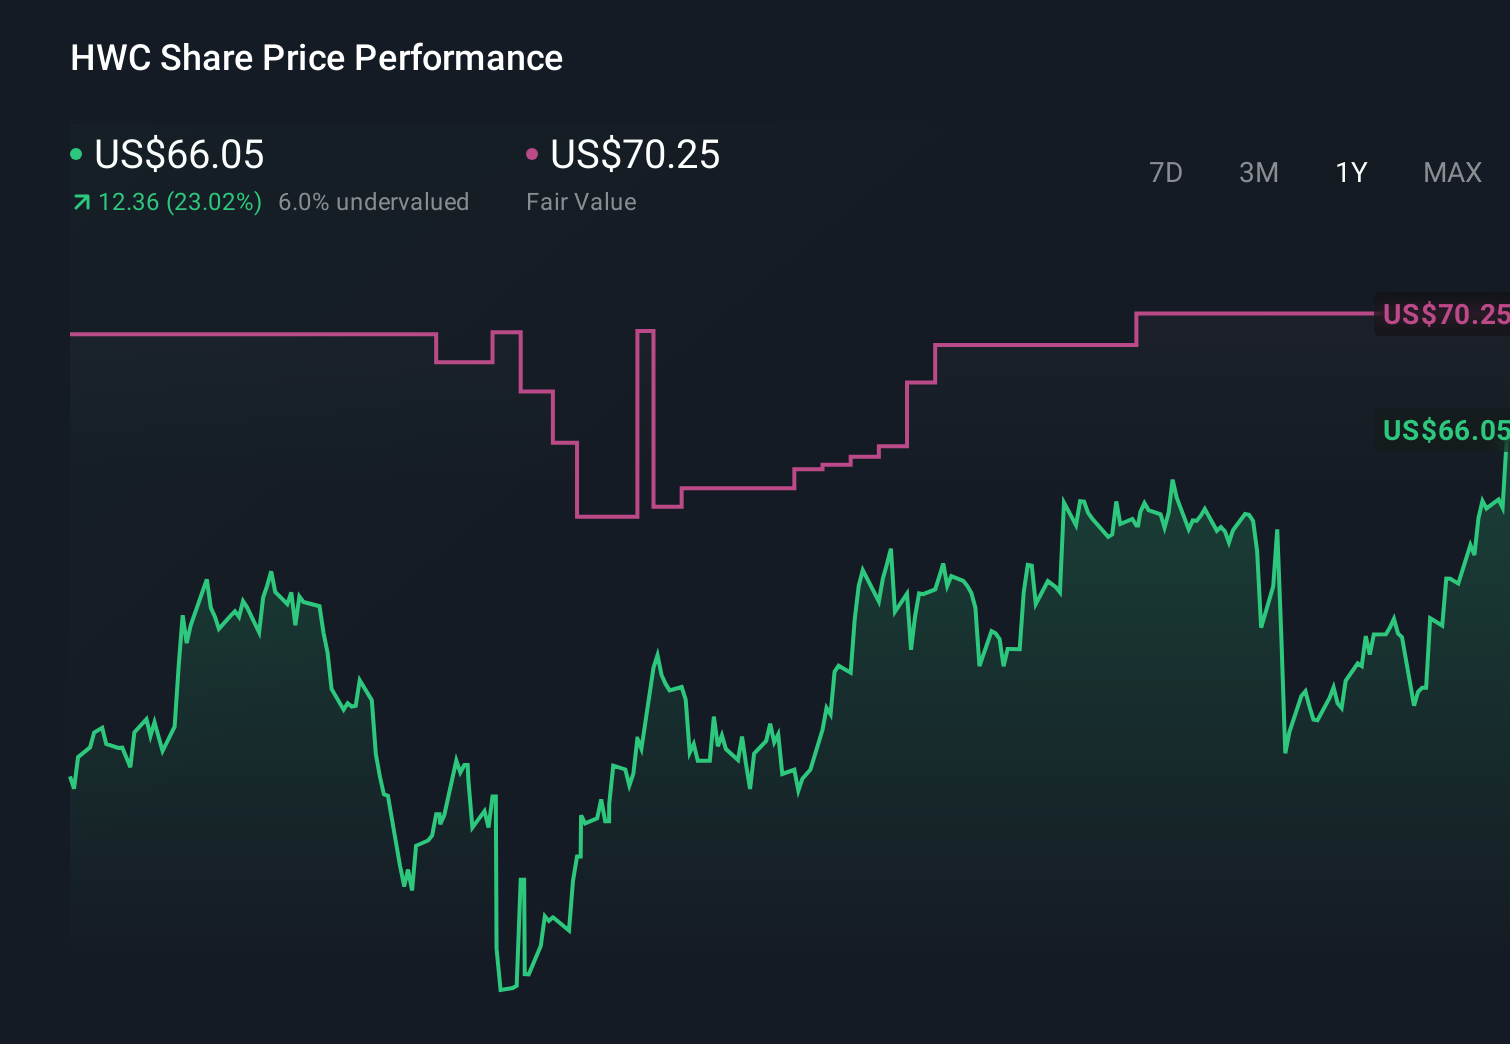
Earlier we mentioned that there is an even better way to understand valuation, so let us introduce you to Narratives, a simple way to turn your view of Hancock Whitney into a story that links its business drivers to a financial forecast and ultimately to a fair value that you can compare with today’s price. On Simply Wall St’s Community page, millions of investors use Narratives to spell out their assumptions for future revenue, earnings and margins, and the platform automatically converts that story into projected cash flows, a fair value estimate and an indication of whether their Fair Value is above or below the current share price. Because Narratives are live models that update as new earnings, news and guidance are released, your view stays current without you having to rebuild a spreadsheet. For example, one Hancock Whitney Narrative might focus on robust loan growth, rising net interest income and ongoing buybacks to support a fair value near $118, while a more cautious Narrative could emphasize slower revenue growth, thinner margins and macro risks to arrive closer to $72, giving you a transparent way to see how different perspectives lead to different valuations and decisions.
Do you think there's more to the story for Hancock Whitney? Head over to our Community to see what others are saying!
This article by Simply Wall St is general in nature. We provide commentary based on historical data and analyst forecasts only using an unbiased methodology and our articles are not intended to be financial advice. It does not constitute a recommendation to buy or sell any stock, and does not take account of your objectives, or your financial situation. We aim to bring you long-term focused analysis driven by fundamental data. Note that our analysis may not factor in the latest price-sensitive company announcements or qualitative material. Simply Wall St has no position in any stocks mentioned.
Have feedback on this article? Concerned about the content? Get in touch with us directly. Alternatively, email editorial-team@simplywallst.com