
Koninklijke Philips (ENXTAM:PHIA) Valuation Check After Recent Share Price Weakness
Koninklijke Philips (ENXTAM:PHIA) has been under quiet pressure lately, with the stock slipping over the past month and past 3 months, even as earnings and revenue continue to grow.
See our latest analysis for Koninklijke Philips.
At around $22.79, the recent 1 month and year to date share price declines suggest momentum has cooled, even though the 3 year total shareholder return near 90% still points to a solid longer term recovery story.
If Philips has you thinking about where healthcare innovation goes next, this could be a handy moment to uncover other opportunities among healthcare stocks.
With profits climbing and shares trading at a sizeable discount to analyst targets and some intrinsic estimates, is Philips now trading below its true worth, or is the market already pricing in its next wave of growth?
Price-to-Earnings of 125.3x: Is it justified?
On a last close of €22.79, Philips currently trades on a price to earnings ratio of 125.3 times. This places it well above typical sector levels and signals a rich valuation versus peers.
The price to earnings multiple compares what investors pay for each euro of current earnings. It is a key yardstick for mature, profitable healthcare technology businesses like Philips. At such a high level, the market is implicitly baking in very strong profit growth and sustained profitability improvements from the company’s recent turn back into the black.
Yet Philips is still early in its post turnaround phase, having only just become profitable again and carrying a low return on equity today, with forecasts pointing to stronger earnings growth in coming years. Against that backdrop, a triple digit price to earnings ratio suggests investors may already be paying up for the recovery narrative, especially when set against much lower benchmarks that the market could ultimately gravitate toward over time.
Compared with both its direct peer group, on 31.3 times earnings, and the broader European medical equipment industry, on 24.8 times, Philips’ 125.3 times price to earnings looks aggressively higher. This underscores how much more investors are currently willing to pay for each euro of its profits.
See what the numbers say about this price — find out in our valuation breakdown.
Result: Price-to-Earnings of 125.3x (OVERVALUED)
However, lingering litigation issues and any slowdown in healthcare capital spending could quickly challenge expectations embedded in Philips’ elevated valuation and recovery story.
Find out about the key risks to this Koninklijke Philips narrative.
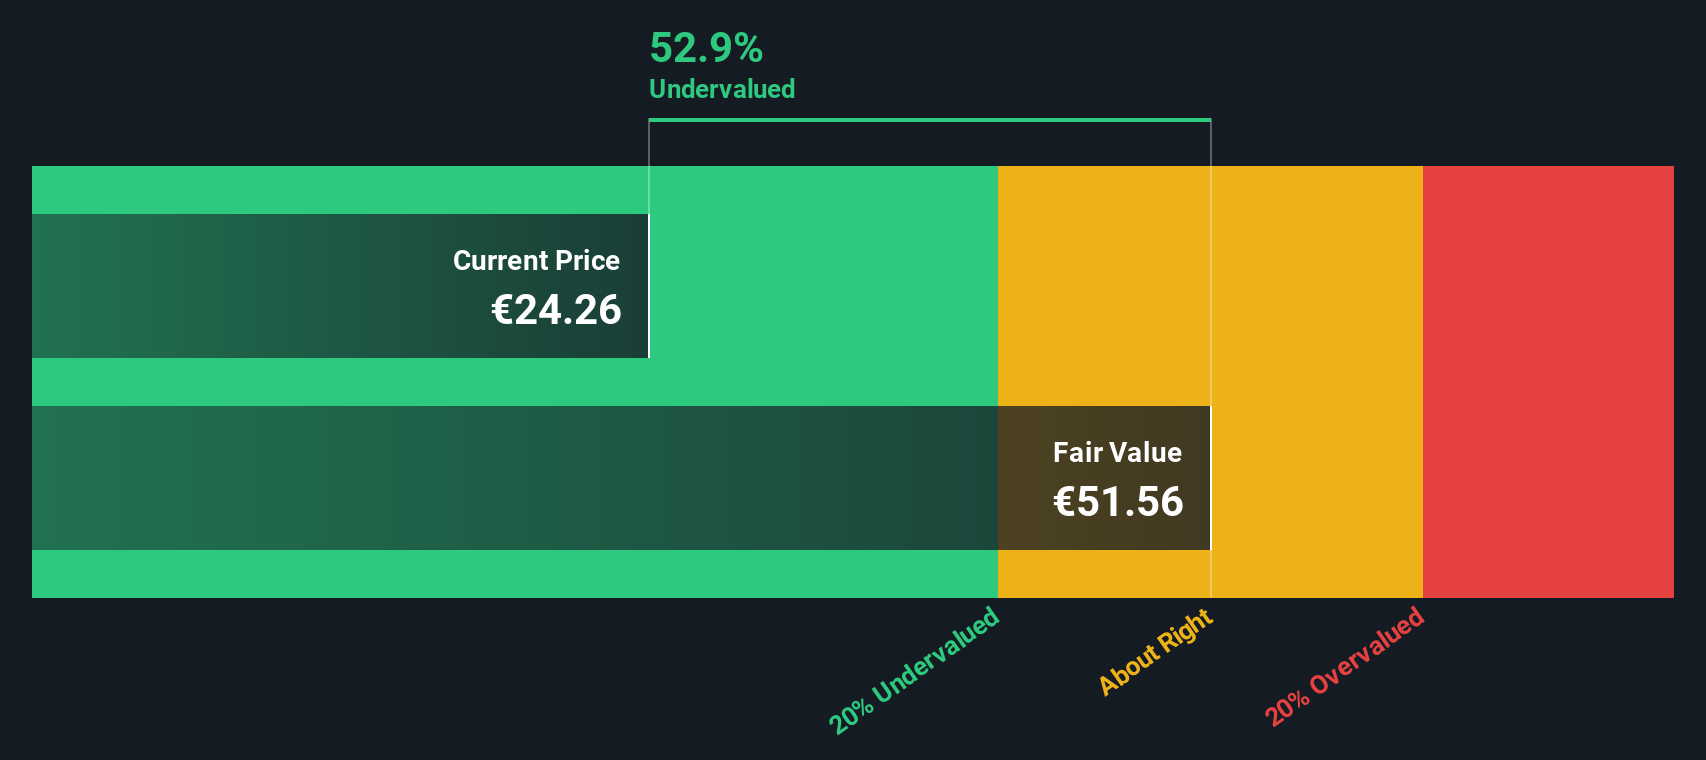
Another View, DCF Points to Deep Value
While the triple digit price to earnings ratio suggests the stock is expensive, our SWS DCF model presents a different perspective. It indicates that Philips is trading about 44.5% below its estimated fair value of €41.09. If the cash flows materialize as projected, this raises the question of whether the market is underestimating the recovery.
Look into how the SWS DCF model arrives at its fair value.
Simply Wall St performs a discounted cash flow (DCF) on every stock in the world every day (check out Koninklijke Philips for example). We show the entire calculation in full. You can track the result in your watchlist or portfolio and be alerted when this changes, or use our stock screener to discover 917 undervalued stocks based on their cash flows. If you save a screener we even alert you when new companies match - so you never miss a potential opportunity.
Build Your Own Koninklijke Philips Narrative
If you would rather dig into the numbers yourself and shape your own view of Philips, you can build a personalized narrative in minutes, Do it your way.
A great starting point for your Koninklijke Philips research is our analysis highlighting 3 key rewards and 2 important warning signs that could impact your investment decision.
Ready for more high conviction ideas?
Before you move on, use the Simply Wall St Screener to pinpoint stocks that match your strategy so you are not leaving better opportunities on the table.
- Capture potential mispricings by targeting companies trading below intrinsic value with these 917 undervalued stocks based on cash flows that still boast solid fundamentals.
- Tap into cutting edge innovation by zeroing in on these 24 AI penny stocks positioned to benefit from powerful advances in artificial intelligence.
- Lock in income focused opportunities by scanning these 13 dividend stocks with yields > 3% that offer attractive yields and room for sustainable payouts.
This article by Simply Wall St is general in nature. We provide commentary based on historical data and analyst forecasts only using an unbiased methodology and our articles are not intended to be financial advice. It does not constitute a recommendation to buy or sell any stock, and does not take account of your objectives, or your financial situation. We aim to bring you long-term focused analysis driven by fundamental data. Note that our analysis may not factor in the latest price-sensitive company announcements or qualitative material. Simply Wall St has no position in any stocks mentioned.
Have feedback on this article? Concerned about the content? Get in touch with us directly. Alternatively, email editorial-team@simplywallst.com