
Is Subaru’s 40% Share Price Surge Justified After Driver Assistance and EV Push?
- Wondering if Subaru's strong run still leaves room for value, or if you are late to the party? This breakdown will help you decide whether the current price makes sense or is setting up the next opportunity.
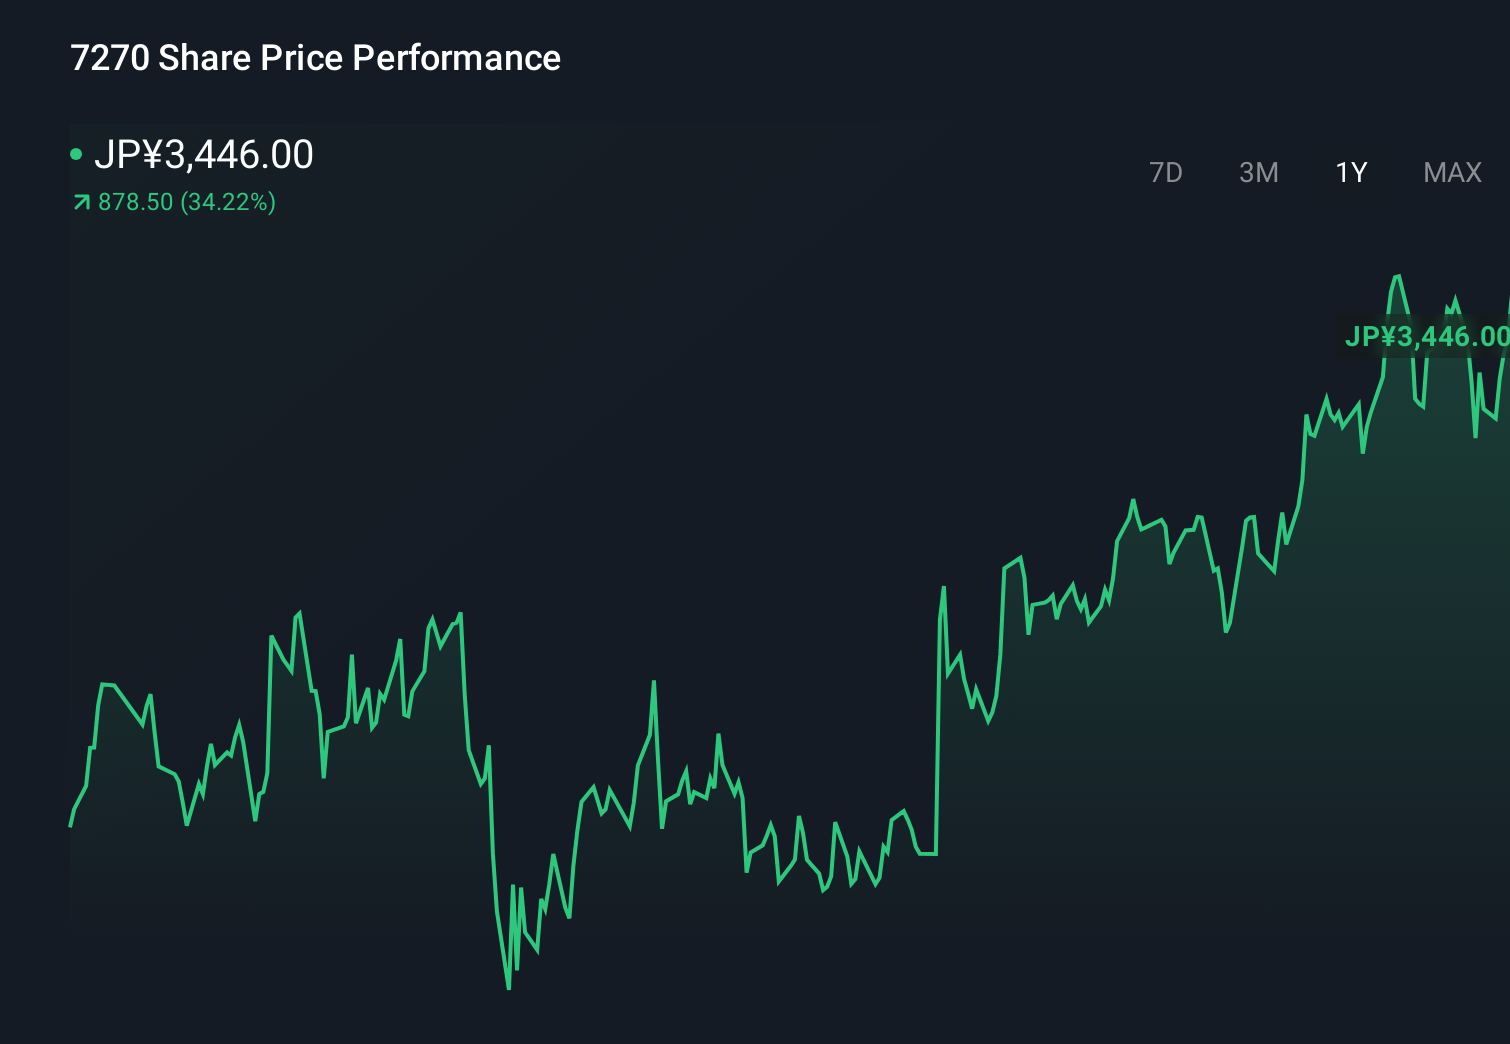
- Subaru's share price has climbed to around JP¥3,446, with gains of 0.2% over the last week, 3.4% over the past month, 25.2% year to date, and 40.1% over the last year that hints at shifting market expectations and growth potential.
- Recent headlines have focused on Subaru's push into advanced driver assistance systems and electrification partnerships, highlighting management's attempts to future proof the brand in a rapidly changing auto market. At the same time, coverage of supply chain normalization and improving global auto demand has added context to why investors are warming up to established manufacturers like Subaru.
- Despite this momentum, Subaru only scores 3/6 on our valuation checks, suggesting it looks undervalued on some measures but not others. Next we will walk through those methods, before finishing with a more intuitive way to think about what Subaru might really be worth.
Approach 1: Subaru Discounted Cash Flow (DCF) Analysis
The Discounted Cash Flow model estimates what Subaru might be worth by projecting its future cash flows and then discounting them back to today using a required rate of return. It focuses on what the business can generate in cash over time, rather than short term market swings.
Subaru currently generates last twelve month free cash flow of roughly ¥263.4 billion. Analysts and extrapolations see this moderating over time, with free cash flow projected at about ¥120.3 billion by 2030, based on a two stage Free Cash Flow to Equity framework that blends analyst estimates with longer term trend assumptions from Simply Wall St. Each future cash flow is discounted back to present value, reflecting risk and the time value of money.
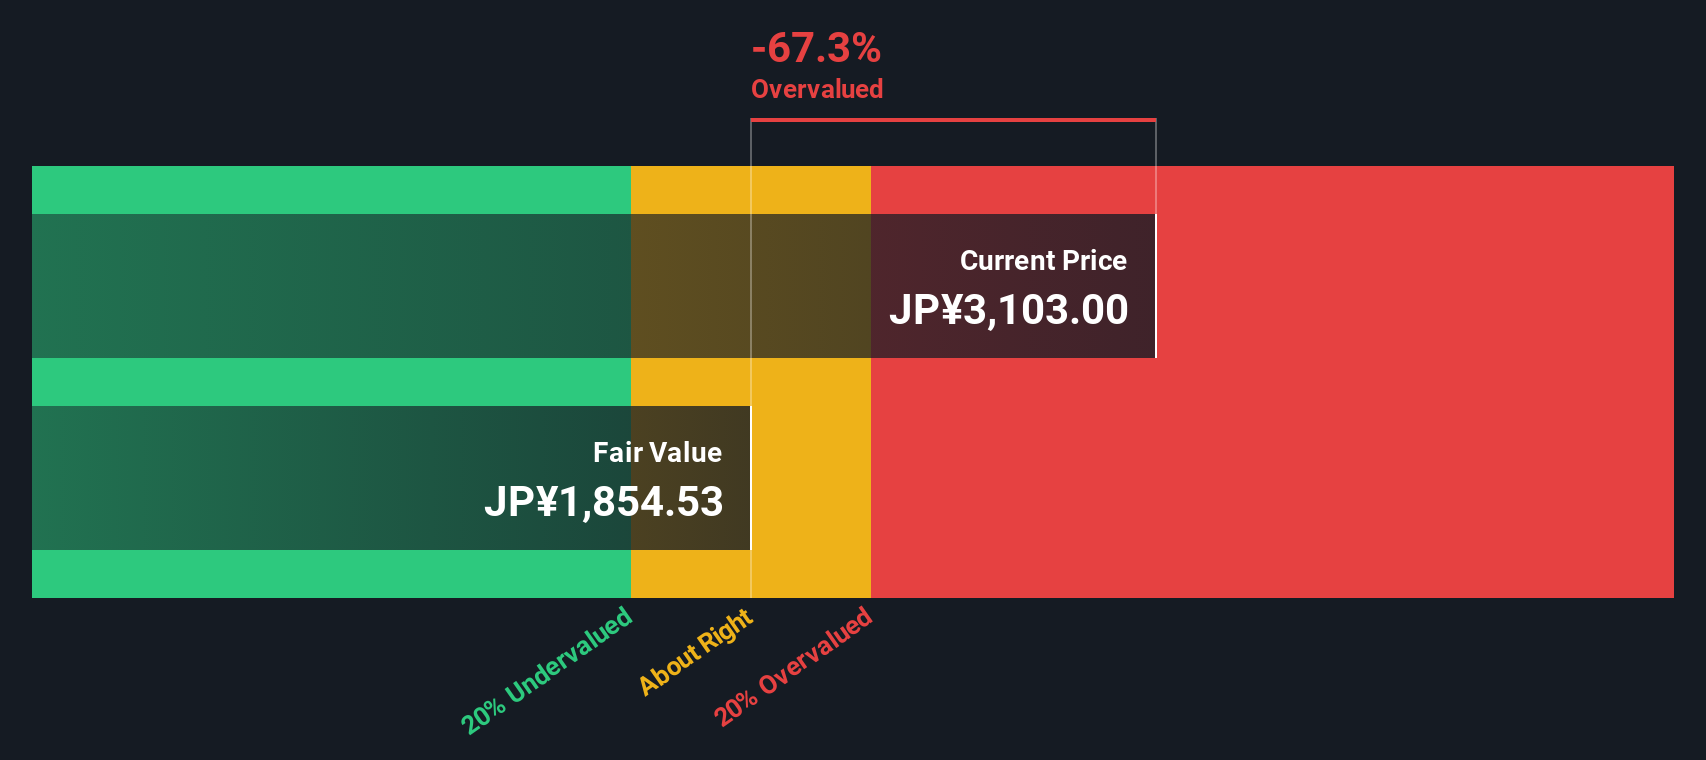
On this basis, the model arrives at an intrinsic value of about ¥2,226 per share, implying the stock is roughly 54.8% above what its cash flows support at today’s price. In other words, investors are currently paying a sizeable premium to the DCF estimate.
Result: OVERVALUED
Our Discounted Cash Flow (DCF) analysis suggests Subaru may be overvalued by 54.8%. Discover 916 undervalued stocks or create your own screener to find better value opportunities.
Approach 2: Subaru Price vs Earnings
For profitable companies like Subaru, the price to earnings ratio is a practical way to gauge valuation because it links what investors pay today to the profits the business is already generating. A higher or lower PE ratio is not good or bad on its own; it reflects how much growth investors expect and how much risk they see in those future earnings.
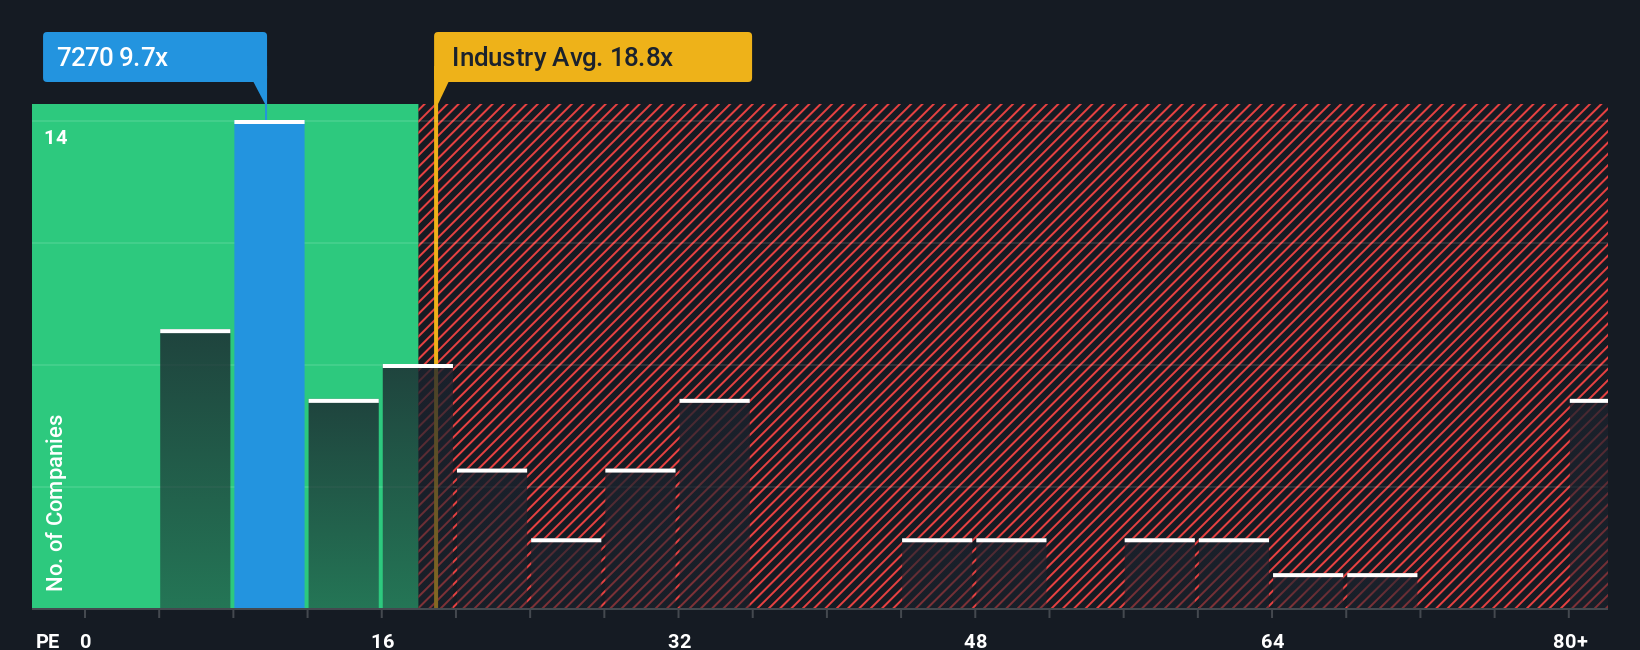
Subaru currently trades on a PE of about 9.3x, which sits well below both the Auto industry average of roughly 18.7x and the peer average of around 13.6x. At first glance that discount suggests the market is pricing Subaru more cautiously than many competitors, despite its recent share price strength.
Simply Wall St also calculates a proprietary Fair Ratio for Subaru of about 14.6x, which estimates the PE the stock should trade on after adjusting for its earnings growth outlook, profitability, risk profile, industry and market cap. This tailored benchmark is more informative than a simple peer or industry comparison because it is specific to Subaru’s fundamentals rather than broad averages. Comparing Subaru’s current 9.3x PE to its 14.6x Fair Ratio points to the shares trading at a meaningful discount to what those fundamentals might justify.
Result: UNDERVALUED
PE ratios tell one story, but what if the real opportunity lies elsewhere? Discover 1455 companies where insiders are betting big on explosive growth.
Upgrade Your Decision Making: Choose your Subaru Narrative
Earlier we mentioned that there is an even better way to understand valuation, so let us introduce you to Narratives, a simple framework that lets you attach a clear story to your numbers by combining your view of Subaru’s future growth, margins and risks with a financial forecast and a fair value estimate. A Narrative links what you believe about the business, for example Subaru winning share with safer cars or struggling to keep up in EVs, to projected revenue and earnings, then turns that forecast into a fair value you can directly compare with today’s share price to help inform whether you buy, hold or sell. Narratives on Simply Wall St, available to millions of investors in the Community page, are easy to create, compare and follow, and they update dynamically as fresh news, results and guidance flow through, so your thesis can evolve with the facts instead of relying on static reports. For example, one Subaru Narrative might assume robust EV adoption and assign a much higher fair value than a more cautious Narrative that expects slower growth and thinner margins.
Do you think there's more to the story for Subaru? Head over to our Community to see what others are saying!
This article by Simply Wall St is general in nature. We provide commentary based on historical data and analyst forecasts only using an unbiased methodology and our articles are not intended to be financial advice. It does not constitute a recommendation to buy or sell any stock, and does not take account of your objectives, or your financial situation. We aim to bring you long-term focused analysis driven by fundamental data. Note that our analysis may not factor in the latest price-sensitive company announcements or qualitative material. Simply Wall St has no position in any stocks mentioned.
Have feedback on this article? Concerned about the content? Get in touch with us directly. Alternatively, email editorial-team@simplywallst.com