
Assessing Monte Rosa Therapeutics (GLUE) Valuation After Encouraging Phase 1/2 Prostate Cancer Trial Results
Monte Rosa Therapeutics (GLUE) just gave investors a fresh catalyst, sharing interim Phase 1/2 data showing 100% disease control and PSA responses in a key prostate cancer subgroup, along with plans for a follow up Phase 2 trial.
See our latest analysis for Monte Rosa Therapeutics.
That strength in the clinic has gone hand in hand with shifting sentiment in the stock, with a 150.08% 3 month share price return and 128.43% 1 year total shareholder return signaling powerful, still building momentum from a $15.83 base.
If Monte Rosa's run has you rethinking where the next big biotech catalyst might come from, this could be a smart moment to explore healthcare stocks for more ideas beyond GLUE.
With shares already more than doubling over the past year but still trading at a steep discount to analyst targets, is Monte Rosa a misunderstood growth story, or is the market already pricing in its next leg higher?
Price-to-Earnings of 49.2x: Is it justified?
Based on a price to earnings ratio of 49.2 times at a last close of $15.83, Monte Rosa currently screens as richly valued against peers.
The price to earnings multiple compares what investors are paying today per share to the company’s current earnings per share, a common yardstick in biotech once profitability emerges. For Monte Rosa, that means the market is assigning a premium price to each dollar of earnings, despite forecasts that profits and revenue are expected to decline over the next few years.
Compared with the broader US biotechs industry average of 21 times earnings and a peer average of 20.5 times, Monte Rosa’s 49.2 times ratio stands out as aggressively higher. It also sits far above the estimated fair price to earnings level of 10.7 times. This highlights how far sentiment has run ahead of what our models suggest the multiple could eventually gravitate toward.
Explore the SWS fair ratio for Monte Rosa Therapeutics
Result: Price-to-Earnings of 49.2x (OVERVALUED)
However, Monte Rosa’s rich valuation faces clear risks, including declining revenue and earnings, and the possibility that pivotal trial data disappoints or slips.
Find out about the key risks to this Monte Rosa Therapeutics narrative.
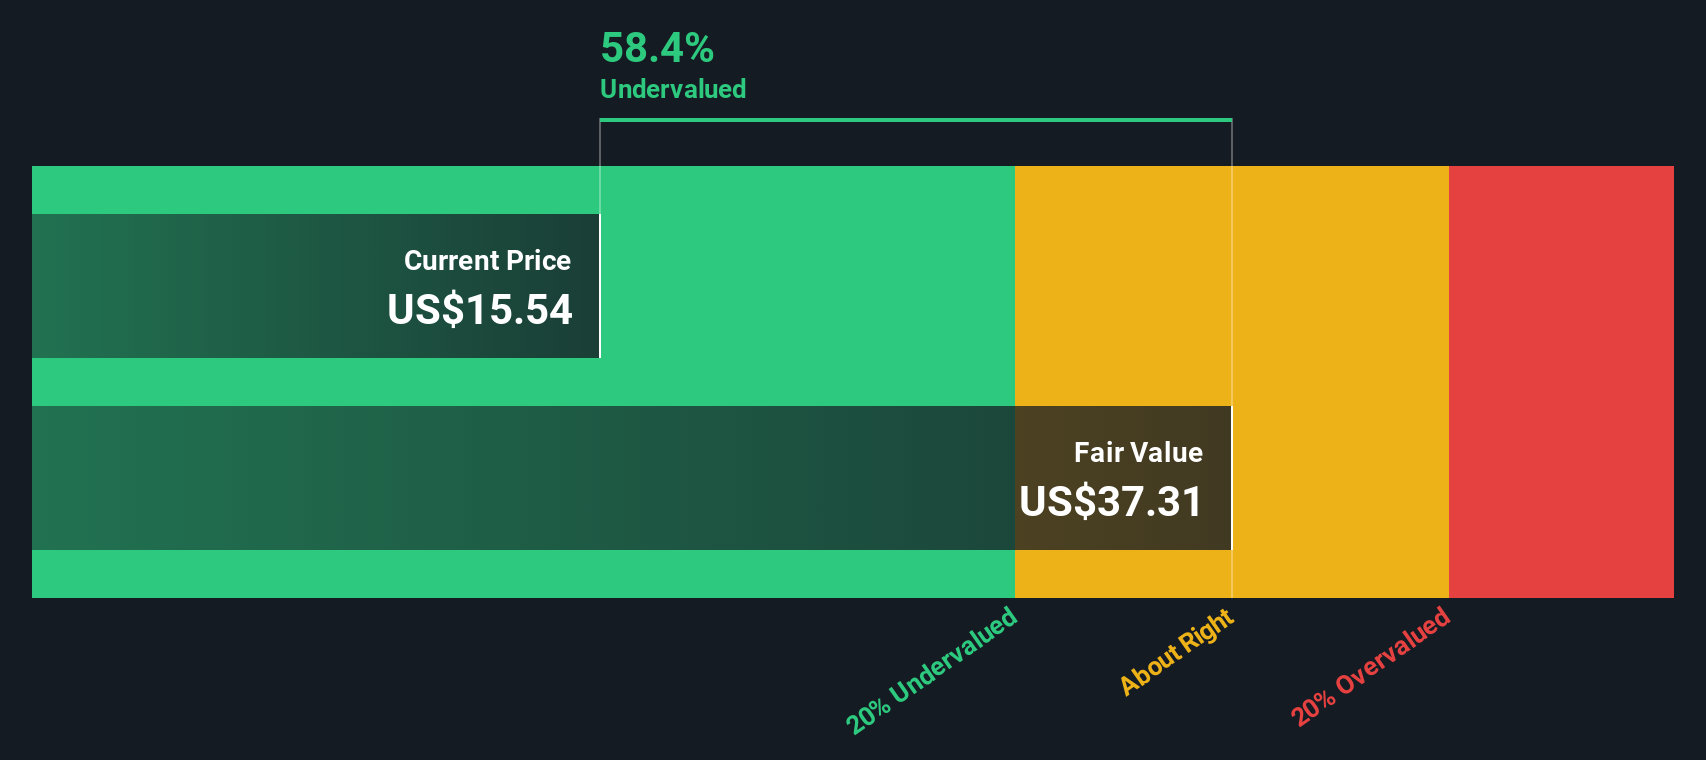
Another View: SWS DCF Points to Deep Undervaluation
While the 49.2 times earnings multiple appears expensive, our DCF model suggests a different perspective, indicating fair value around $37.29 versus today’s $15.83. That implies Monte Rosa is trading at roughly a 57.5% discount, raising the question of whether the market may be overlooking something significant.
Look into how the SWS DCF model arrives at its fair value.
Simply Wall St performs a discounted cash flow (DCF) on every stock in the world every day (check out Monte Rosa Therapeutics for example). We show the entire calculation in full. You can track the result in your watchlist or portfolio and be alerted when this changes, or use our stock screener to discover 915 undervalued stocks based on their cash flows. If you save a screener we even alert you when new companies match - so you never miss a potential opportunity.
Build Your Own Monte Rosa Therapeutics Narrative
If you see things differently or want to dig into the numbers yourself, you can build a personalized view in just minutes: Do it your way.
A great starting point for your Monte Rosa Therapeutics research is our analysis highlighting 2 key rewards and 2 important warning signs that could impact your investment decision.
Ready for your next investing move?
Do not stop with a single ticker. Use the Simply Wall St Screener to uncover fresh, data driven ideas before other investors spot them.
- Capture potential mispricings by reviewing these 915 undervalued stocks based on cash flows that may be trading below their intrinsic value based on future cash flows and fundamentals.
- Target powerful innovation trends by scanning these 24 AI penny stocks that could benefit most from accelerating adoption of artificial intelligence across industries.
- Lock in income opportunities by assessing these 13 dividend stocks with yields > 3% that might strengthen your portfolio with reliable cash returns over time.
This article by Simply Wall St is general in nature. We provide commentary based on historical data and analyst forecasts only using an unbiased methodology and our articles are not intended to be financial advice. It does not constitute a recommendation to buy or sell any stock, and does not take account of your objectives, or your financial situation. We aim to bring you long-term focused analysis driven by fundamental data. Note that our analysis may not factor in the latest price-sensitive company announcements or qualitative material. Simply Wall St has no position in any stocks mentioned.
Have feedback on this article? Concerned about the content? Get in touch with us directly. Alternatively, email editorial-team@simplywallst.com