
Those who invested in Bicecorp (SNSE:BICE) three years ago are up 155%
The most you can lose on any stock (assuming you don't use leverage) is 100% of your money. But when you pick a company that is really flourishing, you can make more than 100%. For instance the Bicecorp S.A. (SNSE:BICE) share price is 102% higher than it was three years ago. Most would be happy with that. On top of that, the share price is up 20% in about a quarter. But this could be related to the strong market, which is up 9.1% in the last three months.
So let's assess the underlying fundamentals over the last 3 years and see if they've moved in lock-step with shareholder returns.
To quote Buffett, 'Ships will sail around the world but the Flat Earth Society will flourish. There will continue to be wide discrepancies between price and value in the marketplace...' By comparing earnings per share (EPS) and share price changes over time, we can get a feel for how investor attitudes to a company have morphed over time.
During three years of share price growth, Bicecorp achieved compound earnings per share growth of 4.0% per year. In comparison, the 26% per year gain in the share price outpaces the EPS growth. So it's fair to assume the market has a higher opinion of the business than it did three years ago. It's not unusual to see the market 're-rate' a stock, after a few years of growth.
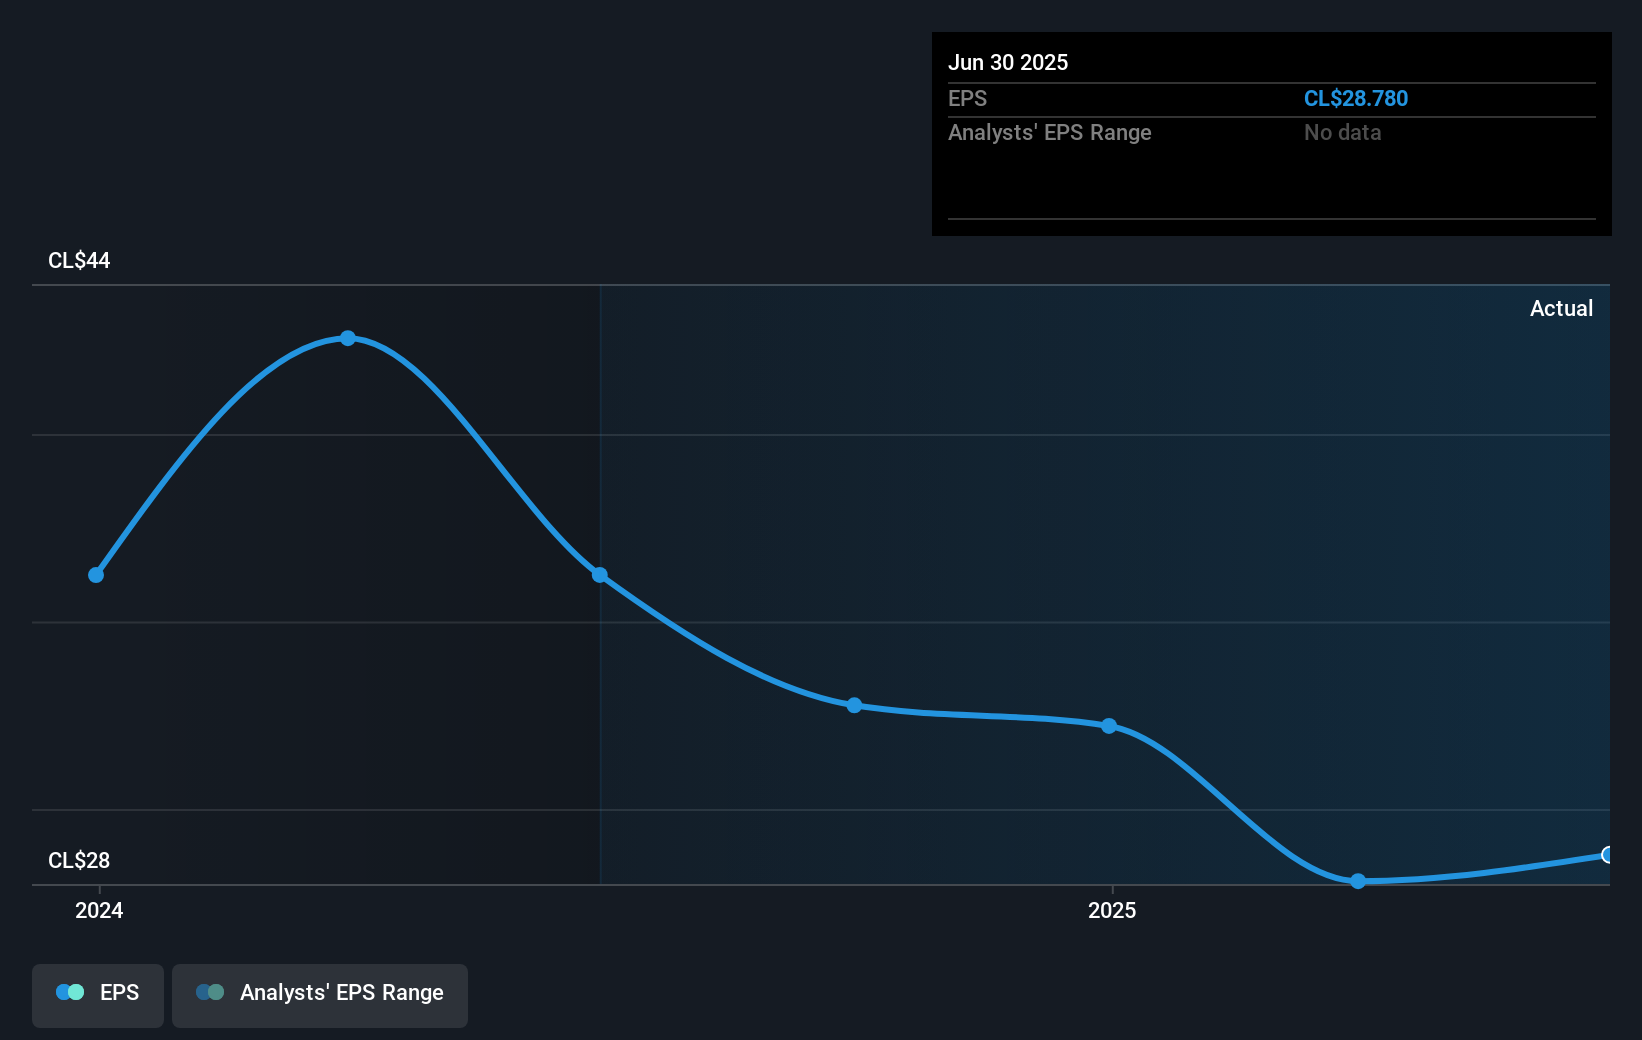
You can see how EPS has changed over time in the image below (click on the chart to see the exact values).
This free interactive report on Bicecorp's earnings, revenue and cash flow is a great place to start, if you want to investigate the stock further.
What About Dividends?
As well as measuring the share price return, investors should also consider the total shareholder return (TSR). The TSR incorporates the value of any spin-offs or discounted capital raisings, along with any dividends, based on the assumption that the dividends are reinvested. So for companies that pay a generous dividend, the TSR is often a lot higher than the share price return. As it happens, Bicecorp's TSR for the last 3 years was 155%, which exceeds the share price return mentioned earlier. This is largely a result of its dividend payments!
A Different Perspective
Bicecorp shareholders have received returns of 50% over twelve months (even including dividends), which isn't far from the general market return. Most would be happy with a gain, and it helps that the year's return is actually better than the average return over five years, which was 23%. Even if the share price growth slows down from here, there's a good chance that this is business worth watching in the long term. Before forming an opinion on Bicecorp you might want to consider the cold hard cash it pays as a dividend. This free chart tracks its dividend over time.
Of course, you might find a fantastic investment by looking elsewhere. So take a peek at this free list of companies we expect will grow earnings.
Please note, the market returns quoted in this article reflect the market weighted average returns of stocks that currently trade on Chilean exchanges.
Have feedback on this article? Concerned about the content? Get in touch with us directly. Alternatively, email editorial-team (at) simplywallst.com.
This article by Simply Wall St is general in nature. We provide commentary based on historical data and analyst forecasts only using an unbiased methodology and our articles are not intended to be financial advice. It does not constitute a recommendation to buy or sell any stock, and does not take account of your objectives, or your financial situation. We aim to bring you long-term focused analysis driven by fundamental data. Note that our analysis may not factor in the latest price-sensitive company announcements or qualitative material. Simply Wall St has no position in any stocks mentioned.