
Arthur J. Gallagher (AJG): Revisiting Valuation After a 10% Pullback Despite Solid Earnings Growth
Recent Performance and Investment Context
Arthur J. Gallagher (AJG) has quietly slipped around 10% over the past year, even as its revenue and net income both grew at roughly 18% and 20% annually. This sets up an interesting valuation check for long term investors.
See our latest analysis for Arthur J. Gallagher.
That pullback has come even as the 5 year total shareholder return sits at a strong 115.9%, while the recent 90 day share price return of minus 15.7% suggests momentum has cooled as investors reassess near term risks versus that growth record.
If AJG’s re rating potential has you thinking more broadly about insurers, it could be a good moment to scan other solid balance sheet and fundamentals stocks screener (None results) for ideas with similar defensive qualities.
With earnings still climbing and the share price sliding, investors now face a key question: is Arthur J. Gallagher quietly slipping into undervalued territory, or is the market simply baking in years of future growth?
Most Popular Narrative: 18.1% Undervalued
With Arthur J. Gallagher last closing at $252.64 against a narrative fair value near $308, the story points to meaningful upside if its growth path holds.
Successful, disciplined execution of the ongoing M&A strategy including the Assured Partners acquisition and a deep pipeline of additional bolt on deals broadens AJG's geographic reach, service offerings, and client base, serving as a catalyst for both revenue and earnings accretion.
Want to see the engine behind that upside call? The narrative leans on accelerating earnings, rising margins, and a future multiple that assumes AJG keeps compounding like a structural growth winner. Curious which financial levers do the heavy lifting in that math, and how long they are expected to last? Dive into the full narrative to unpack the projections driving this valuation.
Result: Fair Value of $308 (UNDERVALUED)
Have a read of the narrative in full and understand what's behind the forecasts.
However, structural shifts toward digital disintermediation, as well as a sharper, sustained pullback in property pricing, could undercut AJG’s growth narrative and valuation upside.
Find out about the key risks to this Arthur J. Gallagher narrative.
Another Angle on Valuation
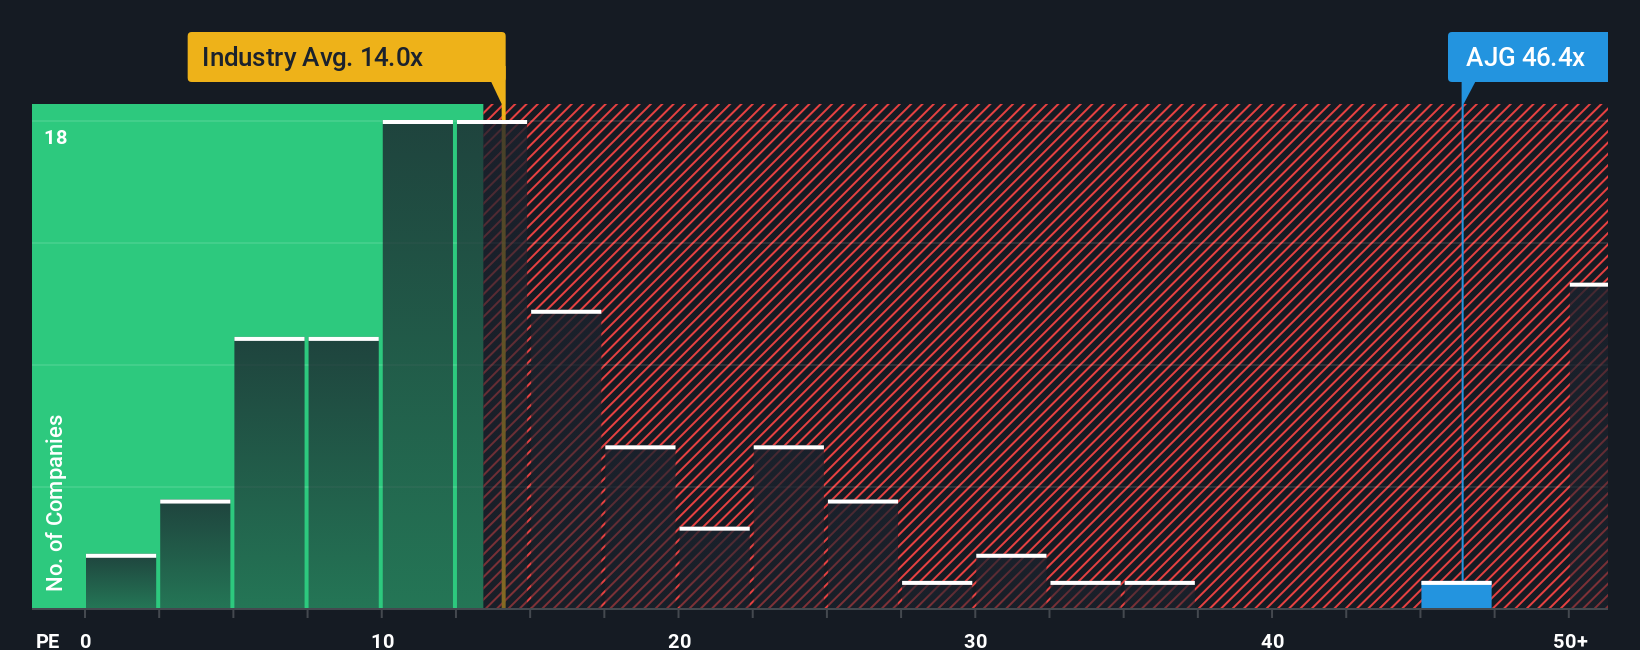
On plain earnings terms, Arthur J. Gallagher looks stretched. It trades on a price to earnings ratio of 40.5 times, versus a fair ratio of 18.3 times, an industry average of 13.5 times and peer average of 23.2 times, which points to meaningful valuation risk if sentiment cools.
See what the numbers say about this price — find out in our valuation breakdown.
Build Your Own Arthur J. Gallagher Narrative
If these views do not fully align with your own, you can dig into the numbers yourself and craft a custom thesis in minutes, Do it your way.
A great starting point for your Arthur J. Gallagher research is our analysis highlighting 3 key rewards and 3 important warning signs that could impact your investment decision.
Ready for more investment ideas?
Now is the moment to widen your opportunity set and use the Simply Wall St Screener to uncover fresh stocks that match your strategy before others move in.
- Consider potential mispricings early by reviewing these 916 undervalued stocks based on cash flows built on strong cash flow fundamentals before the crowd catches on.
- Prepare for transformative tech shifts by scanning these 24 AI penny stocks that could benefit most as artificial intelligence adoption accelerates.
- Seek to strengthen your income stream by targeting these 13 dividend stocks with yields > 3% that may help support returns even when markets turn choppy.
This article by Simply Wall St is general in nature. We provide commentary based on historical data and analyst forecasts only using an unbiased methodology and our articles are not intended to be financial advice. It does not constitute a recommendation to buy or sell any stock, and does not take account of your objectives, or your financial situation. We aim to bring you long-term focused analysis driven by fundamental data. Note that our analysis may not factor in the latest price-sensitive company announcements or qualitative material. Simply Wall St has no position in any stocks mentioned.
Have feedback on this article? Concerned about the content? Get in touch with us directly. Alternatively, email editorial-team@simplywallst.com