
Is Advance Auto Parts a Bargain After a 71.3% Five Year Slump?
- Wondering if Advance Auto Parts is a beaten down bargain or a value trap? You are not alone, and this is exactly the kind of stock where valuation work really matters.
- The share price has slid sharply, down about 11% over the last week, 17.5% in the past month and roughly 71.3% over five years. This tells you sentiment has been reset in a big way.
- Recently, the company has been in focus as investors weigh its store refresh initiatives and parts availability improvements against a still competitive auto parts retail landscape. At the same time, shifting consumer spending patterns and ongoing cost pressures have kept risk perceptions elevated, helping to explain the choppy price action.
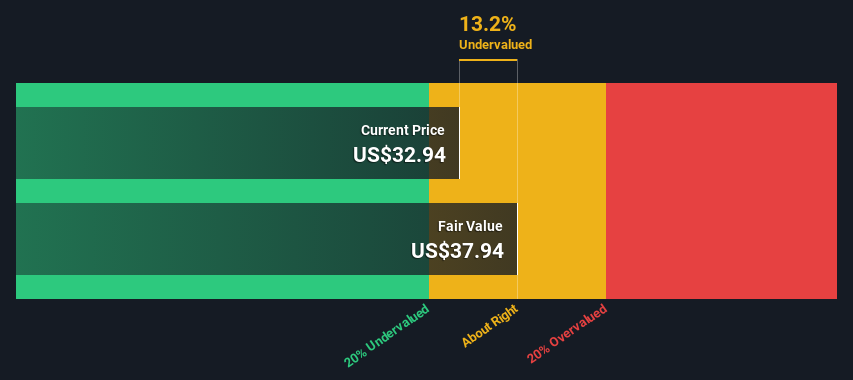
- Our Simply Wall St valuation framework currently gives Advance Auto Parts a 3 out of 6 valuation score, suggesting it looks undervalued on several metrics but not across the board. Next we will break down how different valuation approaches see the stock, before finishing with an even more powerful way to think about its true worth.
Find out why Advance Auto Parts's -3.0% return over the last year is lagging behind its peers.
Approach 1: Advance Auto Parts Discounted Cash Flow (DCF) Analysis
A Discounted Cash Flow model estimates what a business is worth today by forecasting the cash it can generate in the future and discounting those cash flows back to the present.
For Advance Auto Parts, the latest twelve month Free Cash Flow sits at about negative $398.6 Million, indicating the company is currently burning cash rather than generating it. Analysts expect a recovery to positive free cash flow of roughly $58.6 Million by 2026, and our 2 Stage Free Cash Flow to Equity model then extrapolates those analyst inputs over the following decade, gradually moderating growth assumptions after the initial recovery period.
When all of those projected cash flows are discounted back, the DCF model arrives at an intrinsic value of about $6.94 per share. Compared with the current share price, this implies the stock is roughly 494.5% overvalued on a pure cash flow basis, signaling that a lot of future improvement is already priced in and then some.
Result: OVERVALUED
Our Discounted Cash Flow (DCF) analysis suggests Advance Auto Parts may be overvalued by 494.5%. Discover 918 undervalued stocks or create your own screener to find better value opportunities.
Approach 2: Advance Auto Parts Price vs Sales
For many retailers, price to sales is a useful valuation yardstick because revenue tends to be more stable and less affected by short term swings in margins or restructuring charges. Investors are usually willing to pay a higher or lower sales multiple depending on what they expect for future growth and how risky they perceive those sales to be, so faster growth and lower risk normally justify a richer multiple.
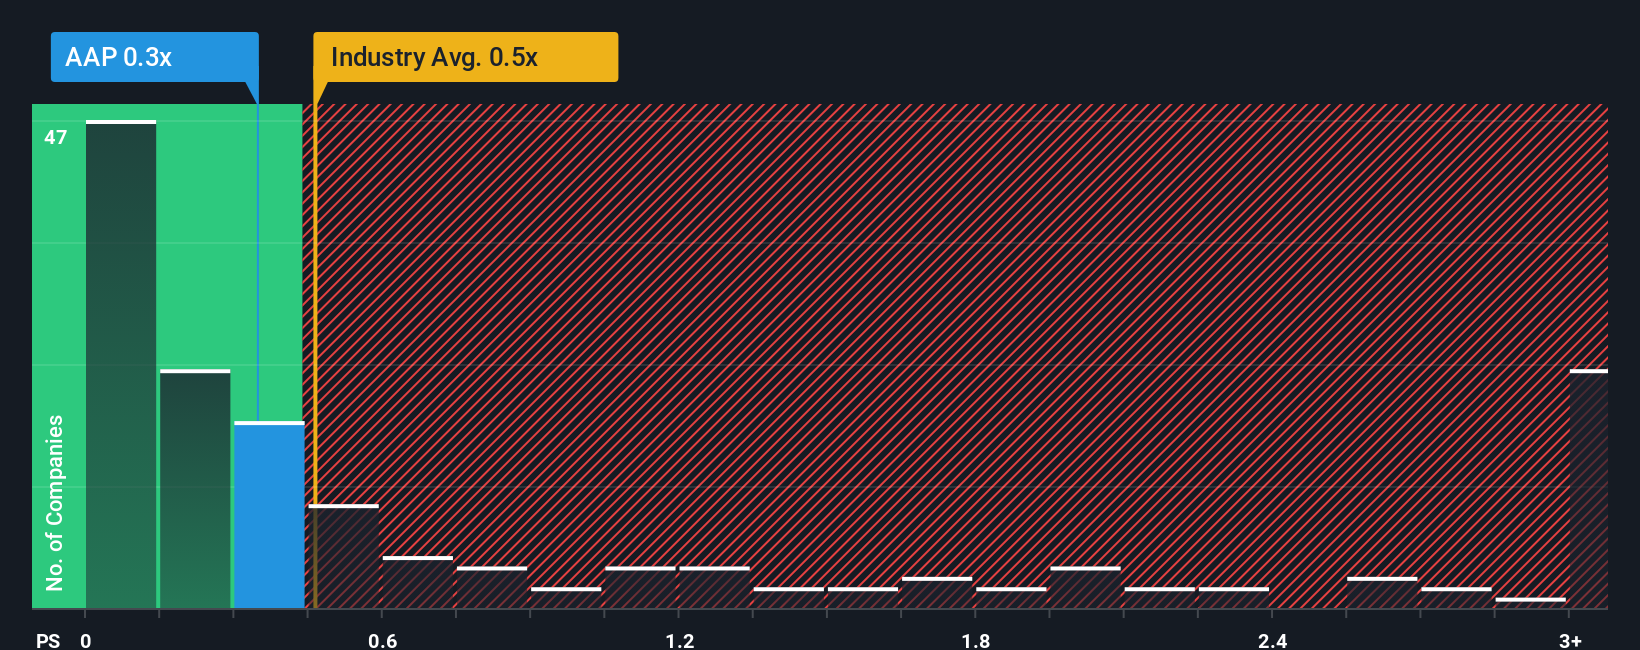
Advance Auto Parts currently trades on a price to sales ratio of about 0.29x, which is well below both the Specialty Retail industry average of roughly 0.53x and the peer group average of around 0.72x. Simply Wall St’s proprietary Fair Ratio for the stock is 0.51x. This represents the sales multiple that results from factoring in its growth outlook, profitability, risk profile, industry positioning and market cap. This Fair Ratio is more informative than a simple peer or industry comparison because it adjusts for company specific strengths and weaknesses rather than assuming all retailers deserve the same multiple. Comparing today’s 0.29x against the 0.51x Fair Ratio suggests the market is pricing in a lot of caution.
Result: UNDERVALUED
PS ratios tell one story, but what if the real opportunity lies elsewhere? Discover 1460 companies where insiders are betting big on explosive growth.
Upgrade Your Decision Making: Choose your Advance Auto Parts Narrative
Earlier we mentioned that there is an even better way to understand valuation, so let us introduce you to Narratives, which are simply the stories investors tell about a company, connecting their assumptions about future revenue, earnings and margins to a fair value estimate. A Narrative links three things together: what you believe about the business, how that belief translates into a financial forecast, and the fair value per share you think those numbers justify. On Simply Wall St, millions of investors share these Narratives on the Community page, making it an easy and accessible tool to see how others are interpreting the same data and how their fair values compare with the current price, helping you decide if it is time to buy, hold or sell. Narratives are dynamic, automatically updating as new information like earnings results, guidance changes, news or buybacks come through. For example, one Advance Auto Parts Narrative might lean bullish, assuming revenue growth around 1.8%, margins above 3% and a fair value near $65, while a more cautious Narrative might expect slower improvement and a fair value closer to $30. Seeing where your own view sits between those extremes is where the real insight lies.
Do you think there's more to the story for Advance Auto Parts? Head over to our Community to see what others are saying!
This article by Simply Wall St is general in nature. We provide commentary based on historical data and analyst forecasts only using an unbiased methodology and our articles are not intended to be financial advice. It does not constitute a recommendation to buy or sell any stock, and does not take account of your objectives, or your financial situation. We aim to bring you long-term focused analysis driven by fundamental data. Note that our analysis may not factor in the latest price-sensitive company announcements or qualitative material. Simply Wall St has no position in any stocks mentioned.
Have feedback on this article? Concerned about the content? Get in touch with us directly. Alternatively, email editorial-team@simplywallst.com