
Has GE’s 501% Three Year Rally Left Much Upside for Investors in 2025?
Valuation snapshot and what the market is pricing in
Before we dive into detailed models and ratios, it helps to zoom out and understand how the market is currently treating General Electric and why.
GE has gone through a multi year transformation that has fundamentally reshaped the business mix, its balance sheet and how investors think about its future cash flows. That matters because a lot of the recent share price performance is not just about cyclical optimism but also about investors reassessing the quality and durability of those cash flows.
Some investors look at a stock that is up 80.3% over the last year and 501.1% over three years and assume they are arriving late. Others see a world class industrial and aerospace platform that might still be catching up to what peers trade at after years of being discounted for past problems.
This is exactly where valuation work becomes crucial, because strong backward looking returns alone do not tell us whether the current price offers a good risk reward trade off or not.
How GE's fundamentals frame the valuation debate
When you strip back the headlines, there are a few core drivers that will do most of the heavy lifting in any valuation of General Electric.
First is the quality of the underlying businesses, particularly in aerospace and power related segments, where long term service contracts and installed base economics can support more stable cash flows than the old perception of GE as a sprawling conglomerate suggested.
Second is the balance sheet and capital allocation story, where deleveraging and portfolio simplification have changed the risk profile compared to just a few years ago. Less financial engineering and more focus on high return industrial operations tends to be rewarded with higher valuation multiples.
Third is the growth runway, including the replacement and upgrade cycles in commercial aviation, energy transition spending and the potential for operating leverage as fixed costs are spread over a growing revenue base.
All of these factors feed directly into both discounted cash flow style valuations and simpler multiple based approaches, and they help explain why the market might be willing to pay up, or not, for each incremental dollar of GE earnings.
General Electric scores just 0/6 on our valuation checks. See what other red flags we found in the full valuation breakdown.
Approach 1: General Electric Discounted Cash Flow (DCF) Analysis
The Discounted Cash Flow model estimates what General Electric is worth today by projecting its future free cash flows and discounting them back to a present value using a required rate of return.
GE currently generates last twelve months free cash flow of about $6.5 Billion. Analyst forecasts, supplemented by extrapolations, point to steady growth, with free cash flow expected to reach around $14.0 Billion by 2035. Over the next decade, projections step up from roughly $8.0 Billion in 2026 to that $14.0 Billion level, reflecting both analyst estimates in the nearer years and Simply Wall St growth assumptions further out.
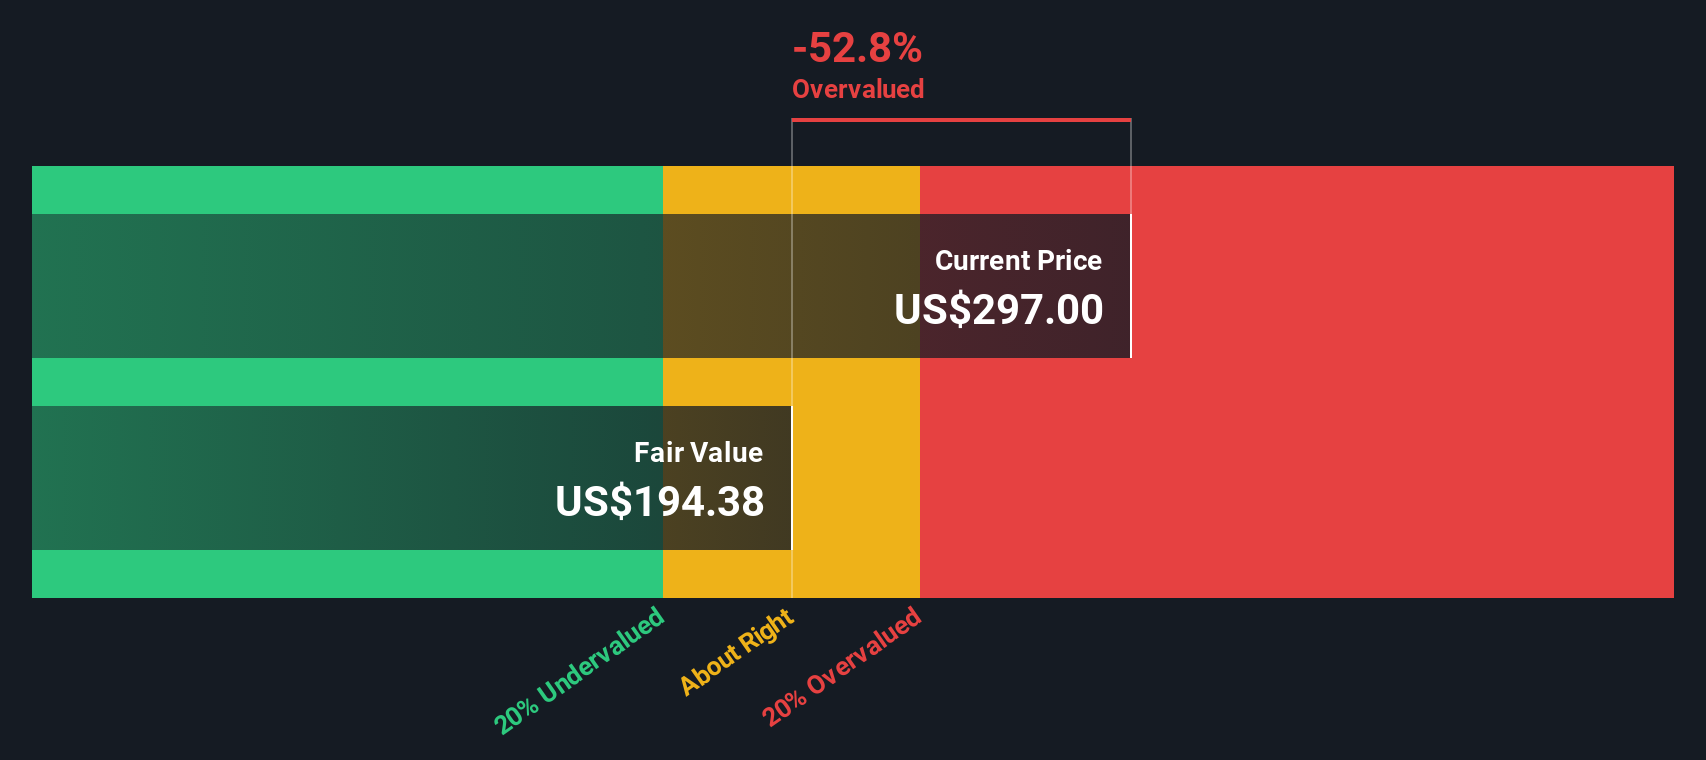
When these cash flows are discounted under a two stage Free Cash Flow to Equity framework, the model suggests an intrinsic value of around $219.63 per share. Compared with the current market price, this implies GE trades at roughly a 37.4% premium to its modeled fair value, which signals that investors are already paying up for a very optimistic cash flow path.
Result: OVERVALUED
Our Discounted Cash Flow (DCF) analysis suggests General Electric may be overvalued by 37.4%. Discover 918 undervalued stocks or create your own screener to find better value opportunities.
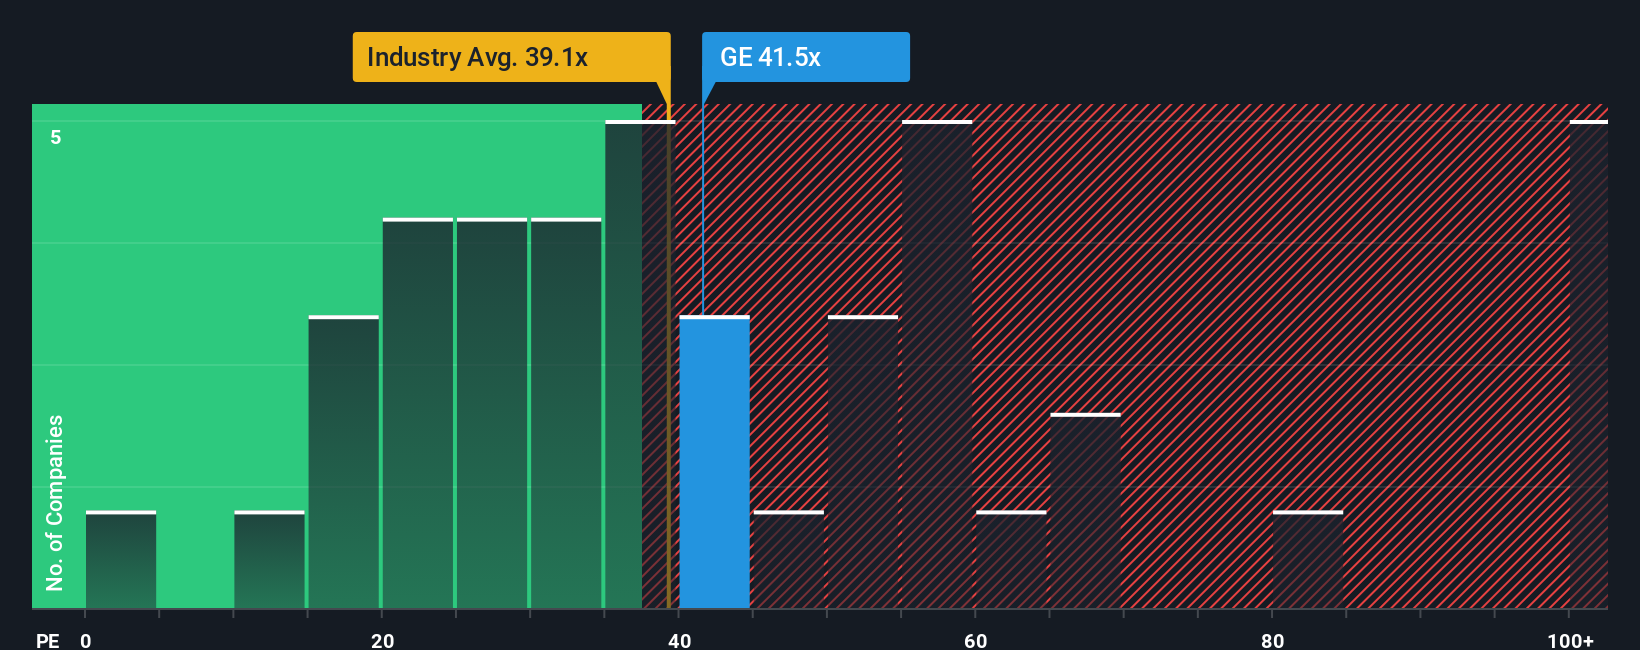
Approach 2: General Electric Price vs Earnings
For a profitable, mature business like General Electric, the price to earnings ratio is a natural way to judge valuation because it links what investors pay today directly to the company’s current earnings power. In general, faster growth and lower perceived risk justify a higher PE multiple, while slower, more volatile earnings streams warrant a lower one.
GE currently trades on a PE of about 39.5x, which sits above the broader aerospace and defense industry average of roughly 36.5x and also above the peer group average of around 25.9x. At face value, that suggests investors are already assigning GE a premium for its earnings profile and future prospects.
Simply Wall St’s Fair Ratio framework refines this further. Instead of only comparing GE with industry or peer averages, it estimates what a reasonable PE should be by incorporating factors such as the company’s earnings growth outlook, risk profile, profit margins, industry positioning and market cap. On this basis, GE’s Fair Ratio comes out at about 36.0x, modestly below the actual 39.5x, which points to the shares being priced a bit ahead of fundamentals rather than outright cheap.
Result: OVERVALUED
PE ratios tell one story, but what if the real opportunity lies elsewhere? Discover 1460 companies where insiders are betting big on explosive growth.
Upgrade Your Decision Making: Choose your General Electric Narrative
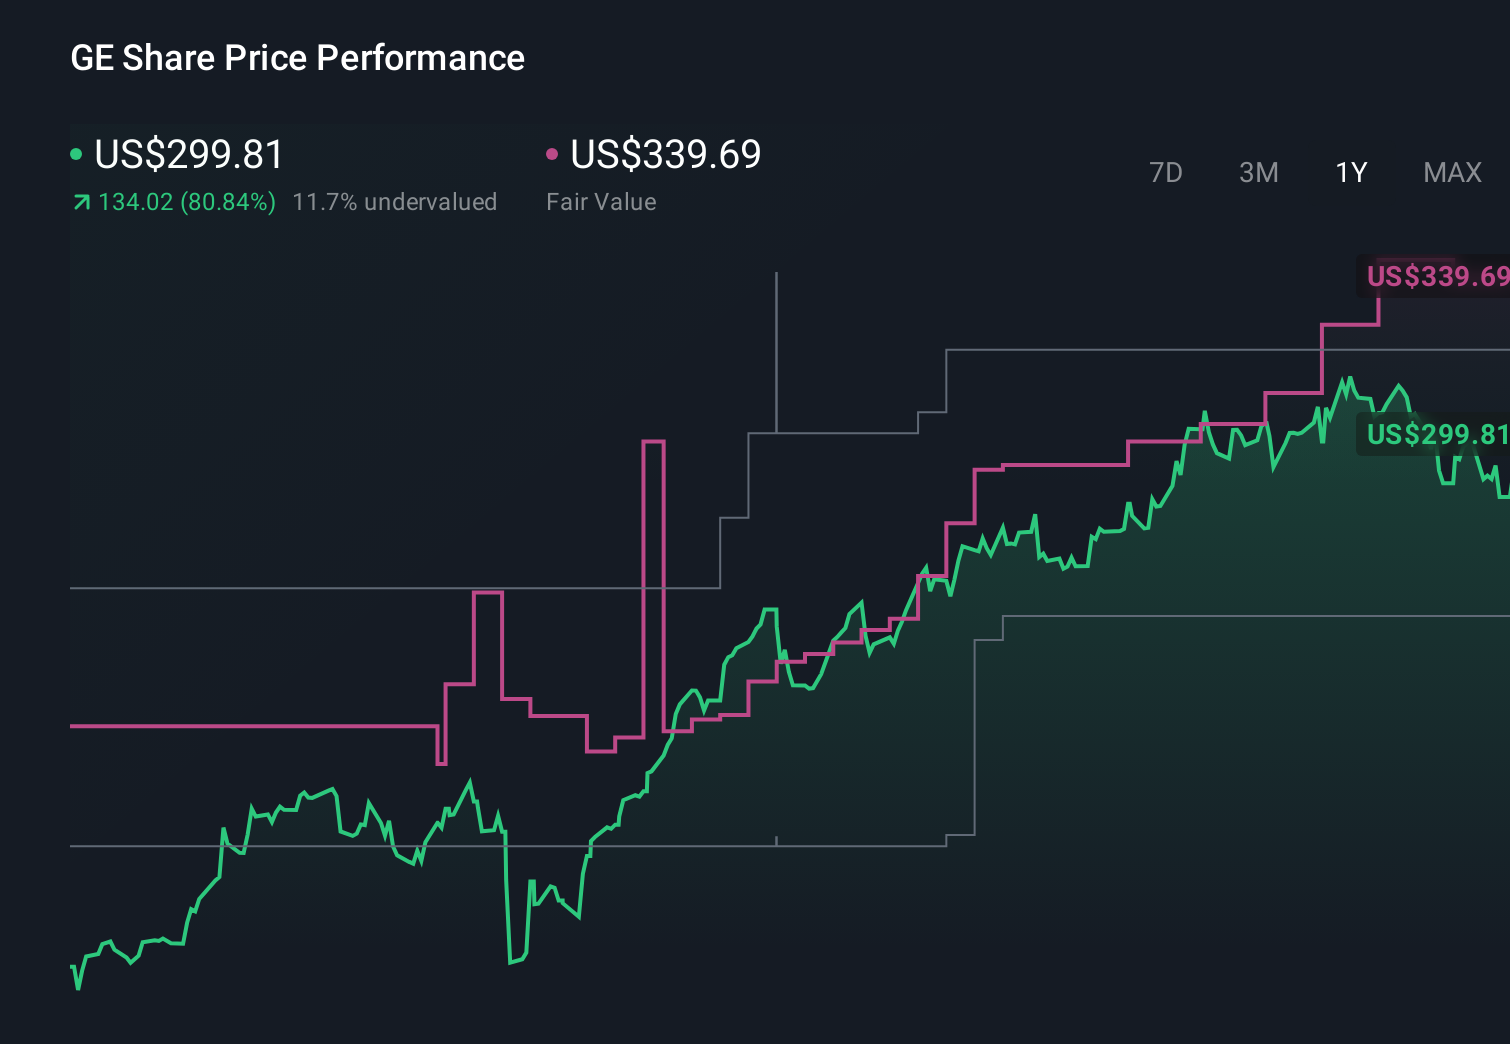
Earlier we mentioned that there is an even better way to understand valuation, so let us introduce you to Narratives, a simple framework on Simply Wall St’s Community page that lets you attach a clear story to your numbers by describing how you think General Electric’s revenue, earnings and margins will evolve. You then link that story to a forecast and to a fair value that you can continuously compare to the current share price to decide whether to buy, hold or sell. The Narrative automatically updates as fresh news and earnings arrive so your view stays live rather than static. For example, one GE investor might build a bullish Narrative around accelerating defense demand, rising margins and a fair value closer to about $340 per share, while another could focus on aviation cyclicality, execution risks and a more conservative fair value nearer $266. Narratives helps both of them see, in one place, how their assumptions, forecasts and fair values differ from the market price and from each other.
Do you think there's more to the story for General Electric? Head over to our Community to see what others are saying!
This article by Simply Wall St is general in nature. We provide commentary based on historical data and analyst forecasts only using an unbiased methodology and our articles are not intended to be financial advice. It does not constitute a recommendation to buy or sell any stock, and does not take account of your objectives, or your financial situation. We aim to bring you long-term focused analysis driven by fundamental data. Note that our analysis may not factor in the latest price-sensitive company announcements or qualitative material. Simply Wall St has no position in any stocks mentioned.
Have feedback on this article? Concerned about the content? Get in touch with us directly. Alternatively, email editorial-team@simplywallst.com