
Has Kohl's Rally Left More Room for Investors After a 61.6% Year to Date Surge?
- Wondering if Kohl's is still a bargain after its recent run up, or if the easy money has already been made? This breakdown will help you decide whether the current price really reflects the underlying business.
- Despite a bumpy week with the share price down 2.6%, Kohl's is still up 47.1% over the last month and an impressive 61.6% year to date. This has quickly changed how the market views its risk and reward profile.
- That sharp move has coincided with a pickup in optimism around brick and mortar retail resilience and ongoing efforts to reshape Kohl's store footprint and merchandise mix. These themes have put traditional retailers back on investors' radar. At the same time, shifting consumer spending patterns and competitive pressures in department stores are keeping a floor under perceived risk, which helps explain why the stock has been volatile even as it trends higher.
- Right now, Kohl's scores a solid 5 out of 6 on our valuation checks, suggesting the stock still looks undervalued on most measures. Next we will unpack those different valuation approaches, before finishing with a more holistic way to think about what the shares are really worth.
Approach 1: Kohl's Discounted Cash Flow (DCF) Analysis
A Discounted Cash Flow model estimates what a business is worth by projecting the cash it can generate in the future and then discounting those cash flows back to today's dollars. For Kohl's, this 2 Stage Free Cash Flow to Equity model starts with last twelve month Free Cash Flow of about $771.8 Million and then applies analyst forecasts for the next few years, with later years extrapolated by Simply Wall St.
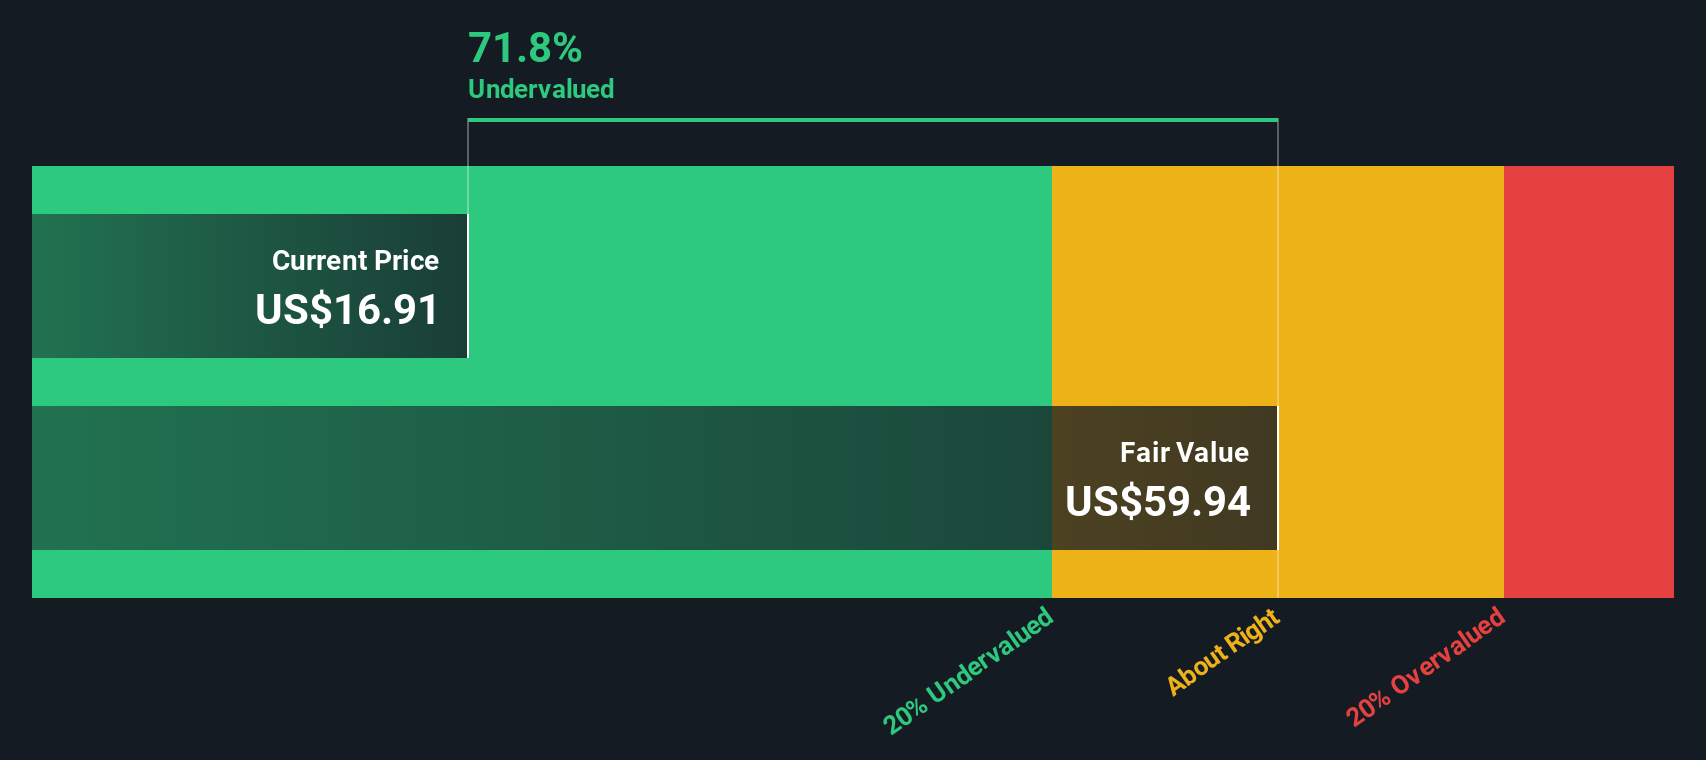
Under this approach, Kohl's Free Cash Flow is projected to be around $881.6 Million by 2035, reflecting modest growth as the business stabilizes and gradually improves efficiency. When all those future cash flows are discounted back to today, the model arrives at an intrinsic value of roughly $65.36 per share.
Compared with the current market price, this implies the stock is trading at a 65.3% discount to its estimated fair value, suggesting investors are still pricing in a lot of risk relative to the cash the business is expected to generate.
Result: UNDERVALUED
Our Discounted Cash Flow (DCF) analysis suggests Kohl's is undervalued by 65.3%. Track this in your watchlist or portfolio, or discover 917 more undervalued stocks based on cash flows.
Approach 2: Kohl's Price vs Earnings
For a profitable retailer like Kohl's, the price to earnings ratio is a practical way to gauge value because it links what investors pay today to the profits the business is already generating. In general, companies with stronger, more reliable growth and lower perceived risk can justify a higher PE multiple, while slower growth or higher uncertainty usually means a lower, more cautious PE is appropriate.
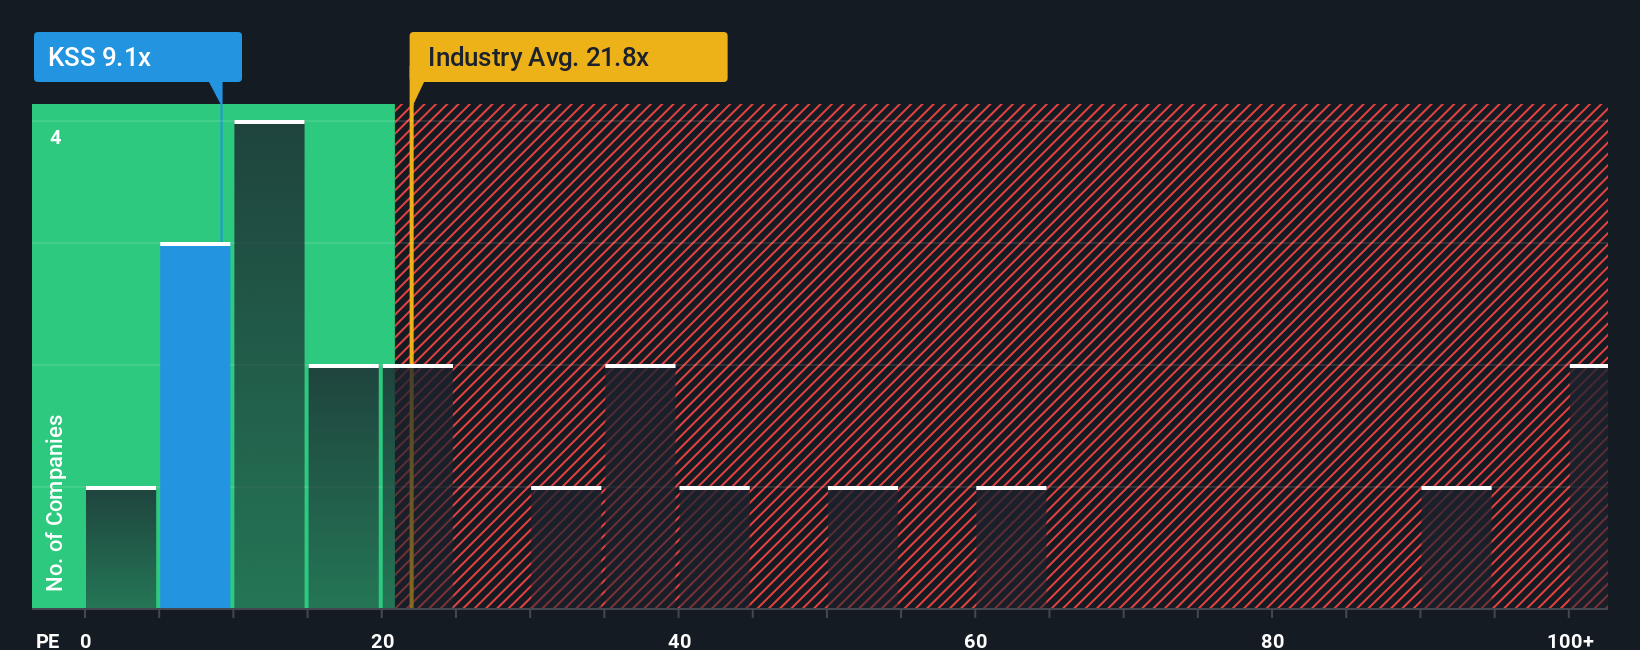
Kohl's currently trades on a PE of about 13.0x, which is well below both the Multiline Retail industry average of roughly 19.2x and the broader peer group average of about 20.3x. Simply Wall St also calculates a proprietary Fair Ratio of around 20.0x for Kohl's, which estimates the PE that would be reasonable given the company’s earnings growth outlook, margins, risk profile, industry and market cap.
This Fair Ratio is more useful than a simple peer or industry comparison because it adjusts for Kohl's specific strengths and risks rather than assuming all retailers deserve the same multiple. Comparing the current 13.0x PE with the 20.0x Fair Ratio suggests the market is still pricing Kohl's well below what its fundamentals would typically warrant.
Result: UNDERVALUED
PE ratios tell one story, but what if the real opportunity lies elsewhere? Discover 1462 companies where insiders are betting big on explosive growth.
Upgrade Your Decision Making: Choose your Kohl's Narrative
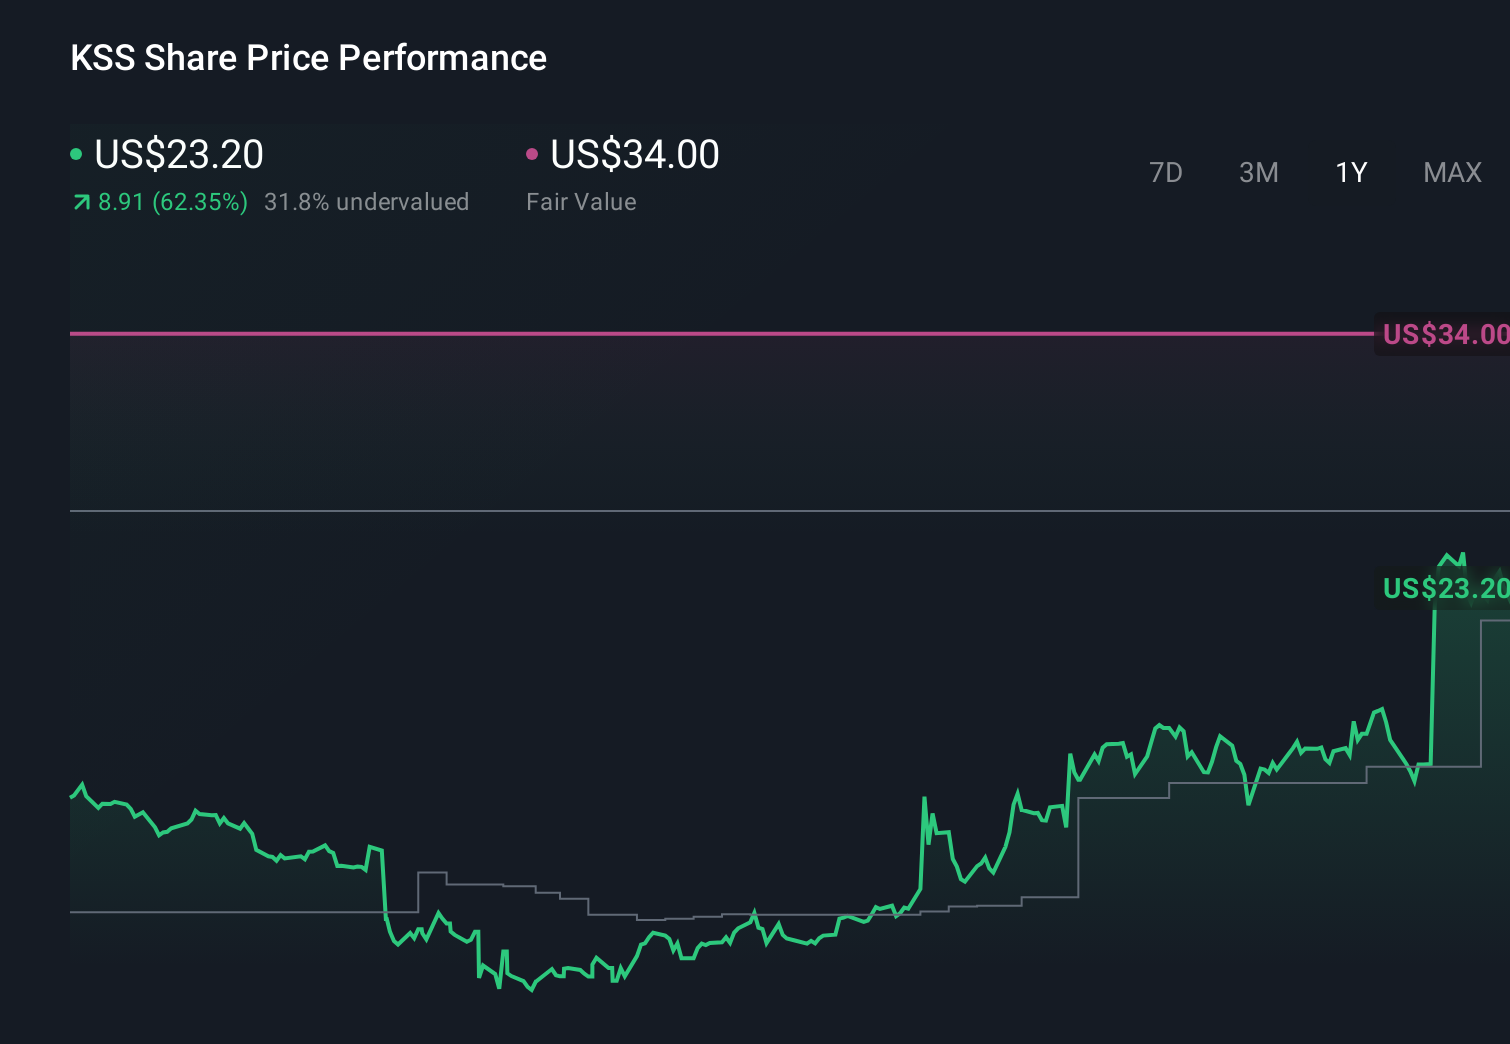
Earlier we mentioned that there is an even better way to understand valuation, so let us introduce you to Narratives, a simple framework that lets you tell the story behind your numbers by connecting your assumptions about Kohl's future revenue, earnings and margins to a clear fair value estimate. A Narrative is your investment thesis written in numbers and words, linking how you think the business will evolve to a financial forecast, and then to what you believe the shares are actually worth. On Simply Wall St, millions of investors use Narratives on the Community page to quickly see whether their Fair Value is above or below today’s Price, which helps them decide if Kohl's is a buy, a hold or a sell. Because Narratives update dynamically as new news, earnings and guidance come in, your valuation stays aligned with reality instead of going stale. For example, one investor might see Kohl's fair value near $34 based on strong real estate backing and cash flows, while another might lean closer to $22 given more cautious assumptions about growth and margins.
For Kohl's, however, we will make it really easy for you with previews of two leading Kohl's Narratives:
Fair value: $34.00 per share
Implied undervaluation vs current price: approximately 33.3%
Assumed revenue growth rate: 48.01%
- Argues Kohl's market cap has disconnected from fundamentals, with shares trading well below both conservative historical valuations and estimated liquidation value.
- Highlights nearly $8 billion in real estate assets, declining debt and solid free cash flow as reasons bankruptcy fears and extreme short interest are likely overdone.
- Sees current pricing near distressed levels as an attractive entry point, with long term upside toward book value of about $34 and potential for a buyout or privatization.
Fair value: $21.82 per share
Implied overvaluation vs current price: approximately 3.9%
Assumed revenue growth rate: 9.83%
- Focuses on structural headwinds from declining store traffic, pressured middle income consumers and slow digital execution that may cap long term revenue and margin upside.
- Assumes modestly improving earnings and margins, but concludes the stock already prices in much of that progress, leaving a relatively balanced risk and reward profile.
- Uses a consensus driven fair value around the low 20s, with execution, competition and macro volatility cited as key risks that could derail a full turnaround.
Do you think there's more to the story for Kohl's? Head over to our Community to see what others are saying!
This article by Simply Wall St is general in nature. We provide commentary based on historical data and analyst forecasts only using an unbiased methodology and our articles are not intended to be financial advice. It does not constitute a recommendation to buy or sell any stock, and does not take account of your objectives, or your financial situation. We aim to bring you long-term focused analysis driven by fundamental data. Note that our analysis may not factor in the latest price-sensitive company announcements or qualitative material. Simply Wall St has no position in any stocks mentioned.
Have feedback on this article? Concerned about the content? Get in touch with us directly. Alternatively, email editorial-team@simplywallst.com