
Can Intuitive Surgical’s Robotic Surgery Growth Justify Its Expensive Valuation in 2025?
- If you are wondering whether Intuitive Surgical is still worth buying at these levels or if the easy money has already been made, you are not alone. This breakdown will help you frame that value question clearly.
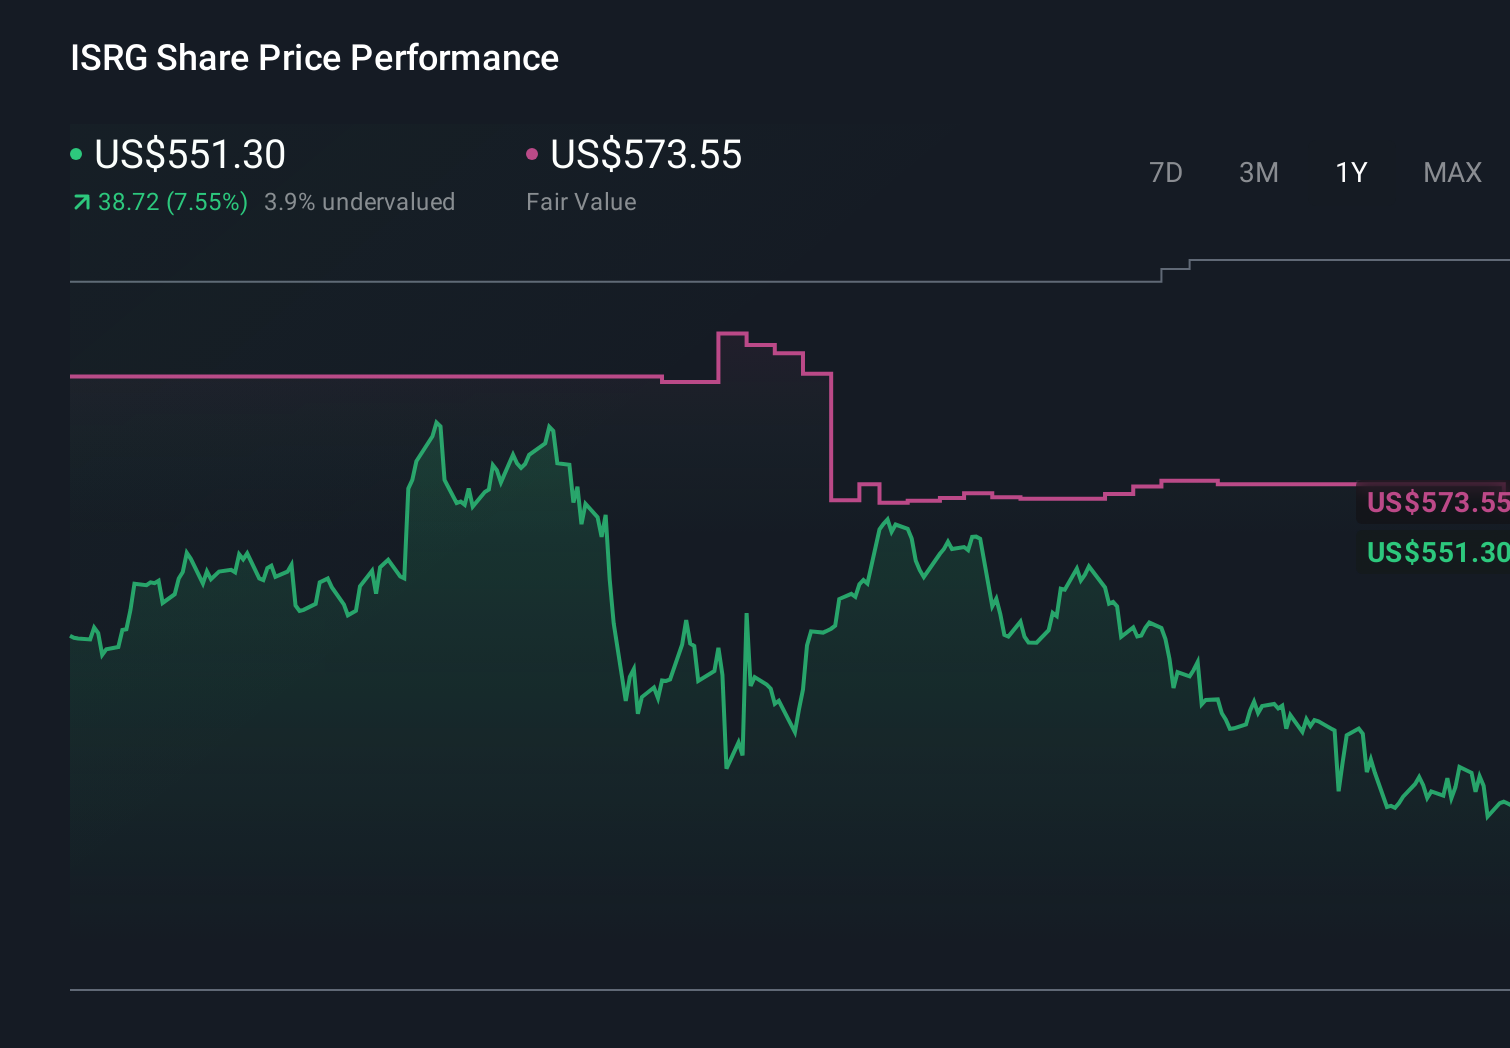
- The stock is up 3.6% over the last week and 7.2% year to date, but its 3 year gain of 113.9% and 5 year gain of 108.9% mean many investors are now asking whether future returns can justify today’s price.
- Recent headlines have focused on Intuitive Surgical’s continued leadership in robotic assisted surgery and expanding procedure volumes, as hospitals lean further into minimally invasive solutions. At the same time, investors have been parsing updates on new system placements and product pipeline progress. These factors help explain why the market has been willing to keep bidding the shares up despite an already rich backdrop.
- Despite that enthusiasm, Intuitive Surgical currently scores just 0/6 on our valuation checks, suggesting the stock does not screen as undervalued on any of the standard metrics. Next we will walk through those methods in detail and then finish with a more nuanced way to think about what this business might really be worth.
Intuitive Surgical scores just 0/6 on our valuation checks. See what other red flags we found in the full valuation breakdown.
Approach 1: Intuitive Surgical Discounted Cash Flow (DCF) Analysis
The Discounted Cash Flow model estimates what a business is worth by projecting its future cash flows and then discounting those cash flows back to today in dollar terms.
For Intuitive Surgical, the latest twelve month free cash flow is about $1.9 billion. Analysts and internal estimates see this rising steadily, with projected free cash flow reaching roughly $7.2 billion by 2035 as the company scales procedures and systems. The earlier years are driven by analyst forecasts, while the later years are extrapolated by Simply Wall St using a 2 stage Free Cash Flow to Equity framework.
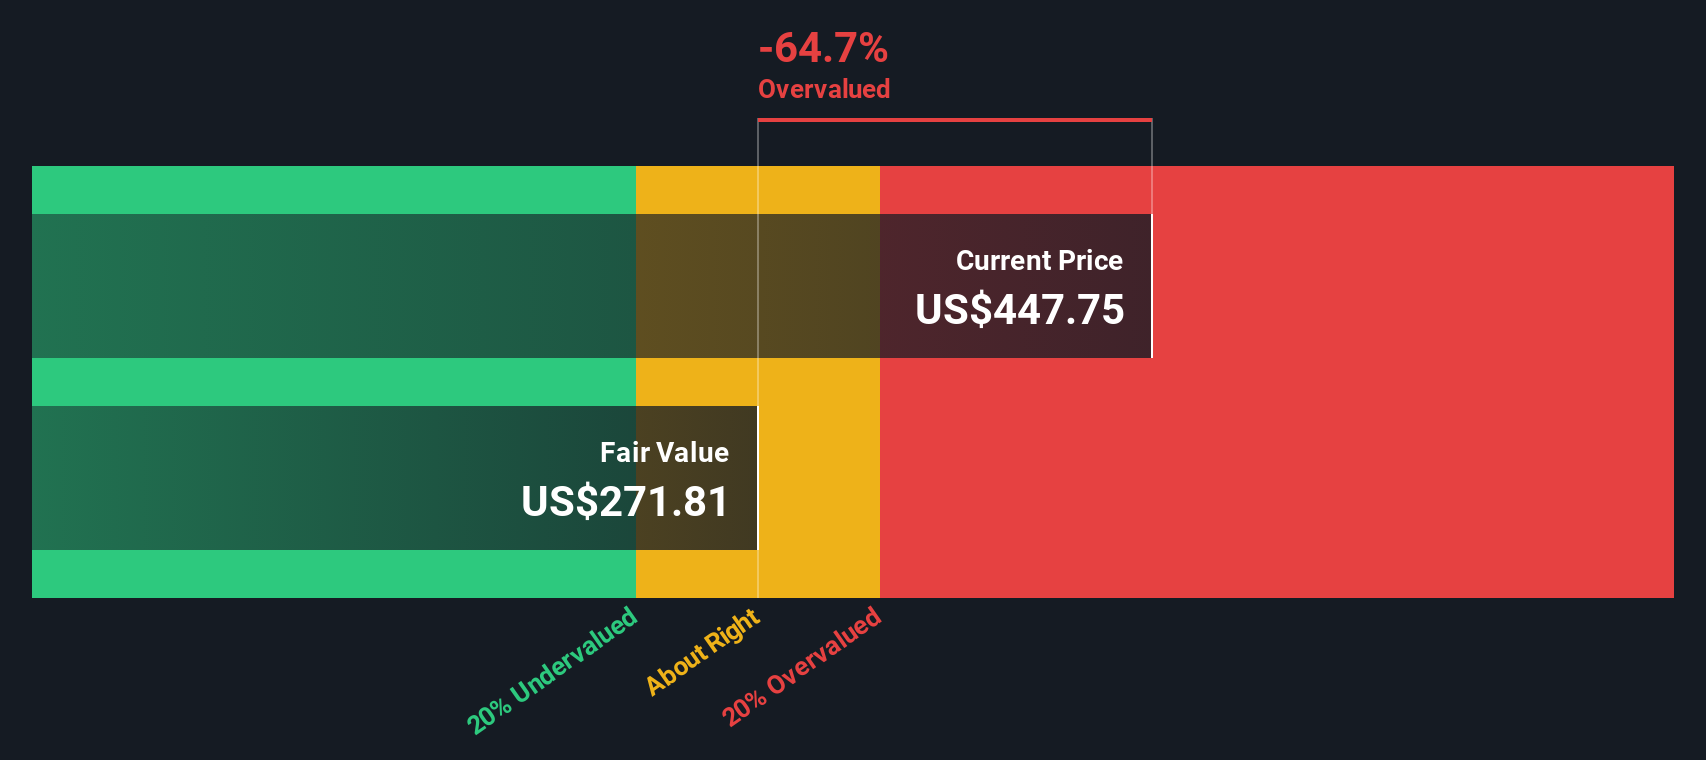
When all of those cash flows are discounted back, the model arrives at an intrinsic value of about $330.63 per share. Compared with the current market price, this suggests the stock is roughly 69.9% overvalued, indicating that a lot of future success may already be reflected in the valuation.
Result: OVERVALUED
Our Discounted Cash Flow (DCF) analysis suggests Intuitive Surgical may be overvalued by 69.9%. Discover 918 undervalued stocks or create your own screener to find better value opportunities.
Approach 2: Intuitive Surgical Price vs Earnings
For profitable companies like Intuitive Surgical, the price to earnings (PE) ratio is a useful lens because it links what investors pay today with the profits the business is already generating. In broad terms, faster growth and lower risk tend to justify a higher, or more generous, PE multiple, while slower growth or higher uncertainty usually call for a lower one.
Intuitive Surgical currently trades at about 72.5x earnings, which is more than double both the Medical Equipment industry average of roughly 30.6x and the peer group average of about 34.8x. To move beyond these blunt comparisons, Simply Wall St calculates a Fair Ratio. This is an estimate of what a sensible PE should be after factoring in the company’s earnings growth outlook, profitability, industry, market value and risk profile. For Intuitive Surgical, that Fair Ratio is around 38.7x, suggesting that even after allowing for its strengths and growth prospects, the present 72.5x multiple embeds a lot of optimism.
Result: OVERVALUED
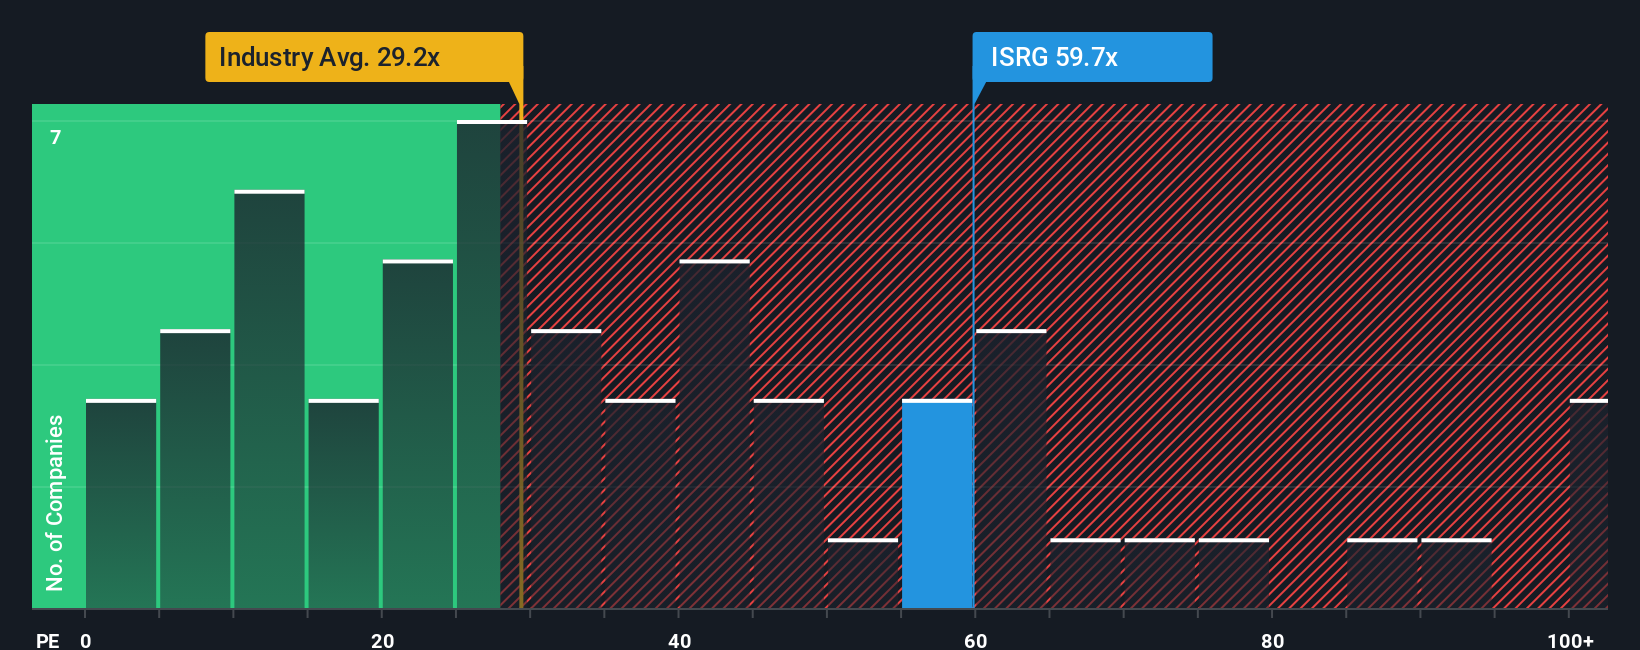
PE ratios tell one story, but what if the real opportunity lies elsewhere? Discover 1466 companies where insiders are betting big on explosive growth.
Upgrade Your Decision Making: Choose your Intuitive Surgical Narrative
Earlier we mentioned that there is an even better way to understand valuation, so let us introduce you to Narratives, which are simply your story about a company, tied directly to your assumptions for its future revenue, earnings, margins and ultimately its fair value.
A Narrative takes the big picture, like Intuitive Surgical’s leadership in robotic surgery and recurring revenue model, and connects it to a transparent forecast and a specific fair value that you can compare with today’s share price to inform a decision on your investment stance.
On Simply Wall St, Narratives live in the Community page, where millions of investors use them as an easy, accessible tool that is automatically refreshed when new data, earnings or news updates arrive, so the story and valuation stay aligned with reality.
For example, one Intuitive Surgical Narrative might assume a fair value near $325 per share while another sees closer to $596, yet both are grounded in different, clearly stated expectations for growth, margins and risk. This gives you a practical way to choose the story and valuation that best matches your view and timing.
For Intuitive Surgical however we will make it really easy for you with previews of two leading Intuitive Surgical Narratives:
🐂 Intuitive Surgical Bull Case
Fair value: $596.36 per share
Implied discount vs last close: approximately 5.8% undervalued
Revenue growth assumption: 13.47%
- Expects strong global procedure growth, an expanding installed base, and rising utilization to support durable recurring revenue and margins.
- Sees product innovation, AI and digital tools, and broader clinical adoption as reinforcing Intuitive Surgical's competitive advantage and long term earnings power.
- Aligns with an analyst consensus fair value near the high $500s, assuming double digit growth and a premium future PE multiple.
🐻 Intuitive Surgical Bear Case
Fair value: $400.91 per share
Implied premium vs last close: approximately 40.1% overvalued
Revenue growth assumption: 12.02%
- Recognizes Intuitive Surgical as a high quality business with a powerful recurring revenue model but argues that the stock price sits well above a reasonable fair value range.
- Highlights that, on conservative free cash flow assumptions, buying at current levels may only offer low single digit annualized returns.
- Suggests patient investors wait for a pullback closer to fair value, while acknowledging that the market rarely offers the stock at a deep discount.
Do you think there's more to the story for Intuitive Surgical? Head over to our Community to see what others are saying!
This article by Simply Wall St is general in nature. We provide commentary based on historical data and analyst forecasts only using an unbiased methodology and our articles are not intended to be financial advice. It does not constitute a recommendation to buy or sell any stock, and does not take account of your objectives, or your financial situation. We aim to bring you long-term focused analysis driven by fundamental data. Note that our analysis may not factor in the latest price-sensitive company announcements or qualitative material. Simply Wall St has no position in any stocks mentioned.
Have feedback on this article? Concerned about the content? Get in touch with us directly. Alternatively, email editorial-team@simplywallst.com