
SSY Group (SEHK:2005): Valuation Check After New China Drug Approvals Expand Commercial Portfolio
SSY Group (SEHK:2005) just cleared an important regulatory hurdle in China, securing NMPA approvals for its Levofloxacin Eye Drops and Compound Sodium Picosulfate Granules, both passing consistency evaluations that support broader commercialization.
See our latest analysis for SSY Group.
Despite the positive news, SSY Group’s HK$2.96 share price still reflects a muted mood, with a negative year to date share price return and a three year total shareholder return that suggests sentiment has cooled even as the product pipeline strengthens.
If this kind of regulatory progress has you thinking beyond a single name, it could be worth exploring other healthcare stocks that might be building similar momentum.
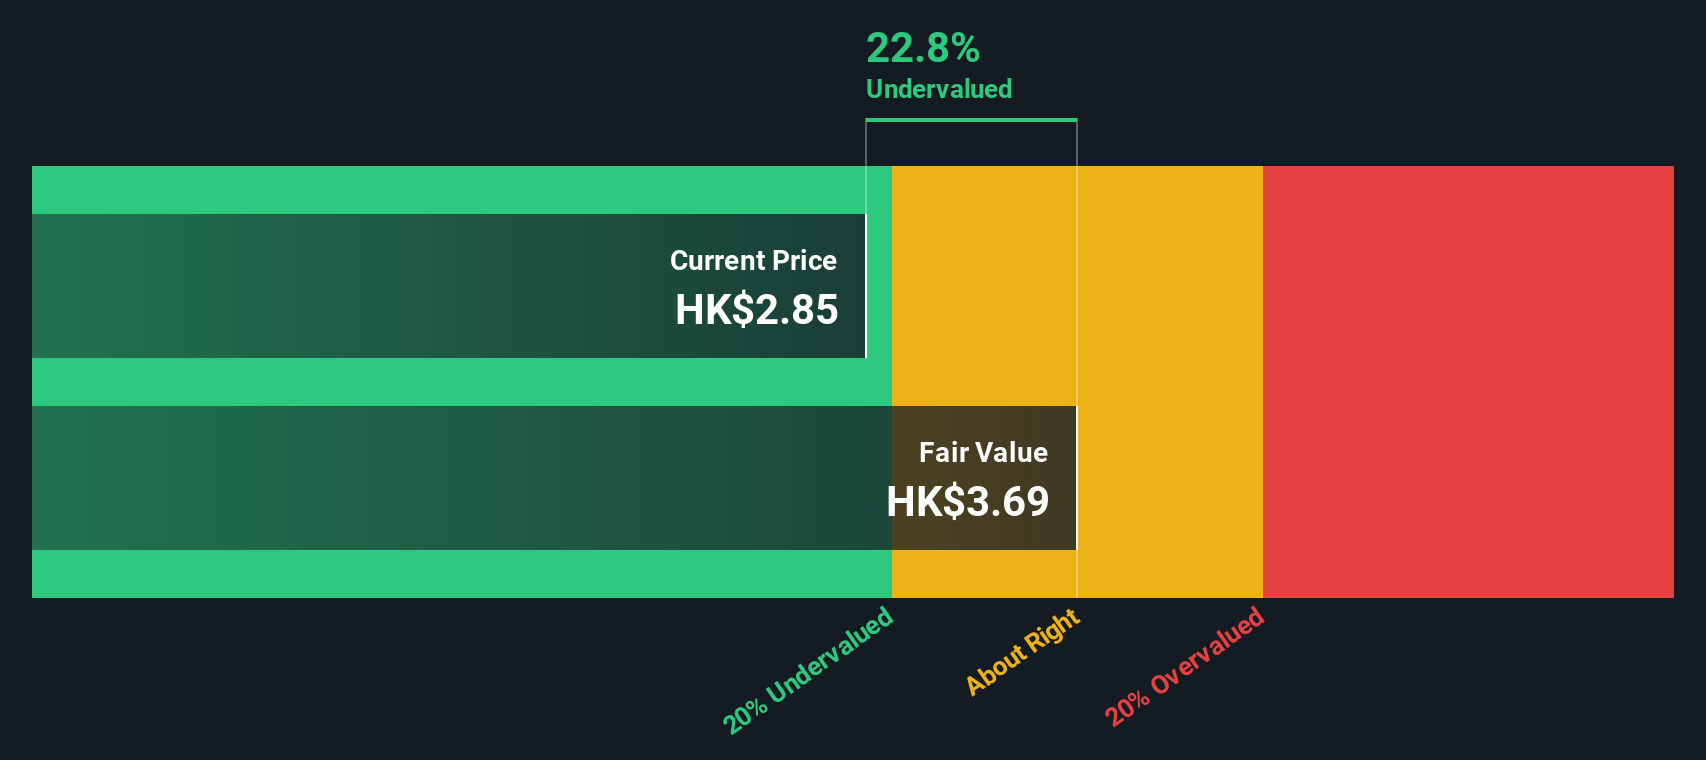
With earnings still growing, a sizeable intrinsic value discount and fresh regulatory catalysts, is SSY Group an overlooked value story in healthcare, or have investors already quietly priced in the next leg of its growth?
Price-to-Earnings of 13x: Is it justified?
On a price-to-earnings basis, SSY Group looks undervalued at HK$2.96, with its 13x multiple sitting below both fair value estimates and peers.
The price-to-earnings ratio compares the current share price to per share earnings, giving a snapshot of how much investors are willing to pay for current profitability. For a profitable, established pharmaceuticals manufacturer like SSY Group, this metric is a central way the market prices in both its present earnings base and expectations for future growth.
SSY Group is trading at 13x earnings, while our fair price-to-earnings ratio for the company sits higher at 17.4x, suggesting the market may not be fully pricing in its forecast 13.17% annual earnings growth or its record of high-quality earnings. The company also looks inexpensive versus the peer average multiple of 25.4x, indicating investors are assigning it a sizeable discount compared to comparable Hong Kong pharmaceuticals names.
Relative to the wider Hong Kong Pharmaceuticals industry average of 13.2x, SSY Group's 13x multiple still leans to the cheaper side, reinforcing the picture of a stock that is modestly priced even in an already fairly valued sector.
Explore the SWS fair ratio for SSY Group
Result: Price-to-Earnings of 13x (UNDERVALUED)
However, sustained share price weakness and reliance on China hospital demand mean that any regulatory, pricing, or volume setbacks could quickly erode the apparent valuation cushion.
Find out about the key risks to this SSY Group narrative.
Another View Using Our DCF Model
Our DCF model paints an even starker picture, putting fair value at around HK$6.44, or roughly 54% above the current HK$2.96 share price. If both earnings multiples and cash flow point to upside, is the market misreading SSY’s risk profile or its growth runway?
Look into how the SWS DCF model arrives at its fair value.
Simply Wall St performs a discounted cash flow (DCF) on every stock in the world every day (check out SSY Group for example). We show the entire calculation in full. You can track the result in your watchlist or portfolio and be alerted when this changes, or use our stock screener to discover 914 undervalued stocks based on their cash flows. If you save a screener we even alert you when new companies match - so you never miss a potential opportunity.
Build Your Own SSY Group Narrative
If you see the story playing out differently, or want to test your own assumptions against the numbers, you can build a custom view in just a few minutes: Do it your way.
A great starting point for your SSY Group research is our analysis highlighting 3 key rewards and 2 important warning signs that could impact your investment decision.
Looking for your next investment move?
Before you log off, refine your process by running a quick screen on fresh ideas that match your style, so opportunities do not slip past you.
- Search for potential multi-baggers early by scanning these 3623 penny stocks with strong financials with solid balance sheets and improving fundamentals before the broader market pays attention.
- Explore structural shifts in automation and data by targeting these 25 AI penny stocks positioned at the core of AI-driven productivity trends.
- Identify candidates for growing income streams by focusing on these 13 dividend stocks with yields > 3% that may support compounding returns through different market environments.
This article by Simply Wall St is general in nature. We provide commentary based on historical data and analyst forecasts only using an unbiased methodology and our articles are not intended to be financial advice. It does not constitute a recommendation to buy or sell any stock, and does not take account of your objectives, or your financial situation. We aim to bring you long-term focused analysis driven by fundamental data. Note that our analysis may not factor in the latest price-sensitive company announcements or qualitative material. Simply Wall St has no position in any stocks mentioned.
Have feedback on this article? Concerned about the content? Get in touch with us directly. Alternatively, email editorial-team@simplywallst.com