
Is Sumitomo (TSE:8053) Fairly Priced After Its 70% 12‑Month Share Price Surge?
Recent performance and why Sumitomo is back on radar
Sumitomo (TSE:8053) has quietly delivered a strong year, with the share price climbing about 70% over the past 12 months and roughly 24% in the past 3 months.
See our latest analysis for Sumitomo.
That move has been backed by a solid run of buying interest, with a 30 day share price return of just over 15% and a three year total shareholder return above 170%. This suggests momentum is still firmly in Sumitomo’s favour.
If Sumitomo’s recent surge has you thinking bigger, this is a good moment to see what else is gaining traction and discover fast growing stocks with high insider ownership
With profits still growing, but the share price already near analyst targets and trading at a premium to some estimates of intrinsic value, is this a fresh buying opportunity or is the market already pricing in future growth?
Price-to-Earnings of 10.6x: Is it justified?
On a price-to-earnings ratio of 10.6 times, Sumitomo looks attractively valued versus the broader Japanese market, even after the strong share price rally.
The price to earnings multiple compares the current share price to per share earnings, making it a straightforward way to gauge how much investors are paying for today’s profits. For a diversified trading and industrial group like Sumitomo, it is a widely used yardstick because earnings growth, capital intensity and cyclicality are key to how the market prices the business.
Against peers, there is a mixed picture. The stock trades below the Japanese market’s price to earnings of 14.2 times and well below its own estimated fair price to earnings of 20.4 times, suggesting investors could push the multiple higher if current earnings strength proves sustainable or keeps improving. Yet it sits slightly above the Japan Trade Distributors industry average of 10.1 times, indicating the market is already assigning a small premium versus sector peers to Sumitomo’s earnings power.
Explore the SWS fair ratio for Sumitomo
Result: Price-to-Earnings of 10.6x (ABOUT RIGHT)
However, risks remain, including Sumitomo’s exposure to cyclical commodities and global trade flows, where a downturn could quickly compress margins and earnings.
Find out about the key risks to this Sumitomo narrative.
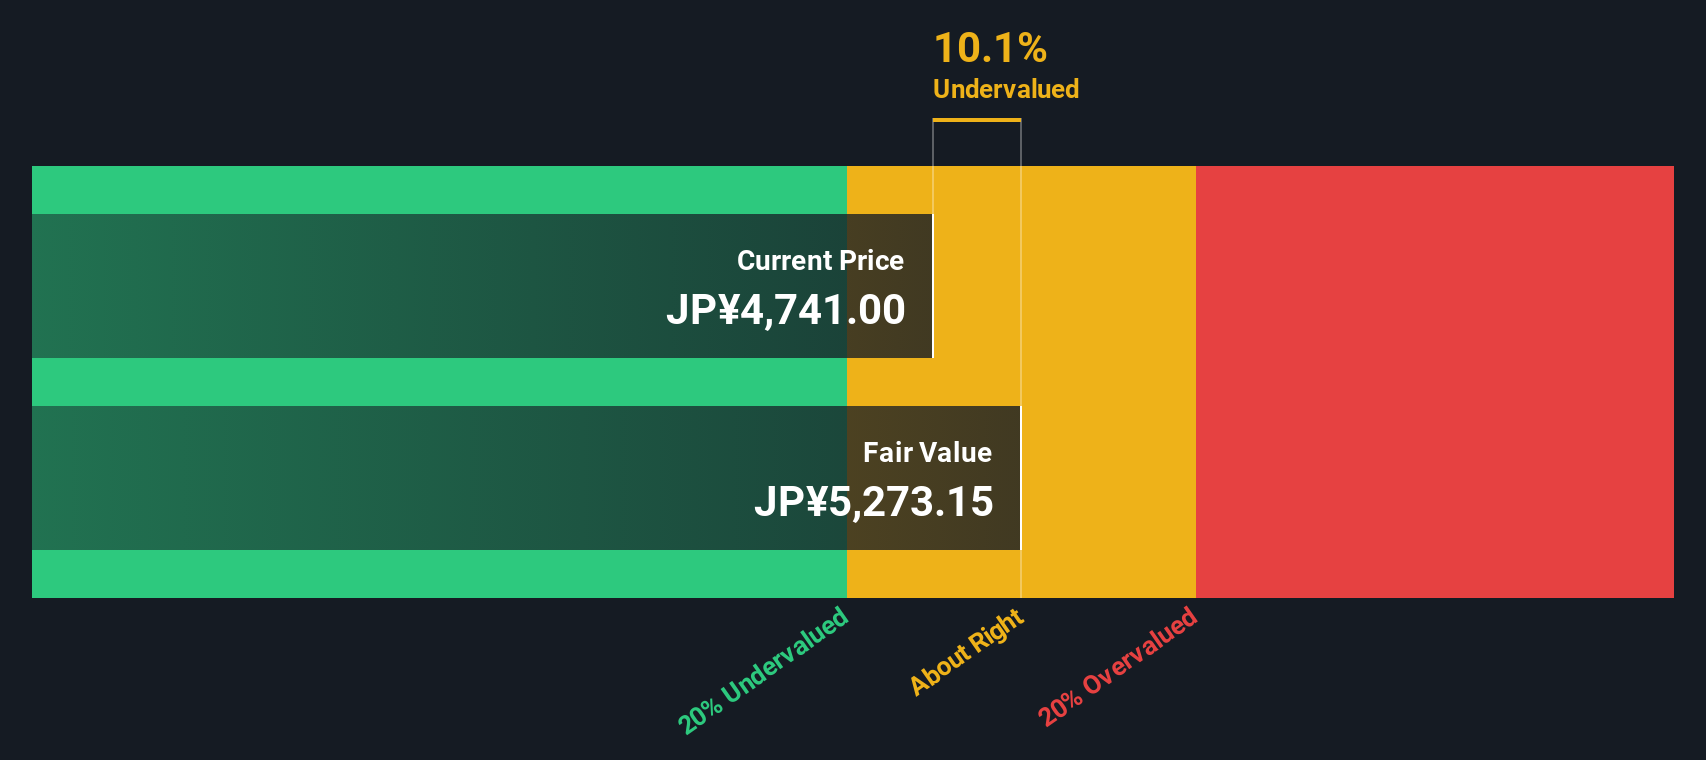
Another View: DCF Points to Caution
While the 10.6 times earnings multiple hints at value, our DCF model is less upbeat and suggests that Sumitomo is trading above its fair value of ¥4,284.9 at the current ¥5,397 price. If cash flows disappoint, today’s optimism could unwind faster than expected.
Look into how the SWS DCF model arrives at its fair value.
Simply Wall St performs a discounted cash flow (DCF) on every stock in the world every day (check out Sumitomo for example). We show the entire calculation in full. You can track the result in your watchlist or portfolio and be alerted when this changes, or use our stock screener to discover 914 undervalued stocks based on their cash flows. If you save a screener we even alert you when new companies match - so you never miss a potential opportunity.
Build Your Own Sumitomo Narrative
If you see the story differently or want to dive deeper into the numbers yourself, you can build a personalized view in just minutes: Do it your way
A great starting point for your Sumitomo research is our analysis highlighting 3 key rewards and 2 important warning signs that could impact your investment decision.
Ready for your next investing move?
Sumitomo might be on your radar, but you could miss larger opportunities if you stop here. Use the Simply Wall St Screener to explore what might come next.
- Scan these 914 undervalued stocks based on cash flows to look for companies that are still trading below their estimated cash flow value.
- Explore these 25 AI penny stocks to find businesses positioned at the center of artificial intelligence developments.
- Review these 13 dividend stocks with yields > 3% to identify companies offering dividend yields above 3% with the backing of listed businesses.
This article by Simply Wall St is general in nature. We provide commentary based on historical data and analyst forecasts only using an unbiased methodology and our articles are not intended to be financial advice. It does not constitute a recommendation to buy or sell any stock, and does not take account of your objectives, or your financial situation. We aim to bring you long-term focused analysis driven by fundamental data. Note that our analysis may not factor in the latest price-sensitive company announcements or qualitative material. Simply Wall St has no position in any stocks mentioned.
Have feedback on this article? Concerned about the content? Get in touch with us directly. Alternatively, email editorial-team@simplywallst.com