
Is It Too Late To Consider CSW Industrials After Its 164.2% Three Year Surge?
- If you have been wondering whether CSW Industrials at around $305 a share is still worth buying after its big run over the years, you are not alone and this article is going to unpack exactly what you are paying for.
- The stock has cooled off slightly in the last week with a -4.1% move, but that comes after a strong 25.9% jump over the last month and a powerful 164.2% gain over three years, even though it is still down -14.3% over the past year and -13.0% year to date.
- Recent headlines around CSW Industrials have focused on its role as a niche industrial solutions provider, including ongoing investments in HVAC, sealing, and specialty chemicals that support long term infrastructure and building trends. Investors have also been paying attention to managements capital allocation decisions and balance sheet strength, which help frame whether the recent volatility is an opportunity or a warning sign.
- Right now CSW Industrials scores just 1 out of 6 on our valuation checks, suggesting it only screens as undervalued on one measure. Next we will walk through the different valuation approaches behind that score and then finish with a more holistic way to judge whether the stock really deserves its current price tag.
CSW Industrials scores just 1/6 on our valuation checks. See what other red flags we found in the full valuation breakdown.
Approach 1: CSW Industrials Discounted Cash Flow (DCF) Analysis
A Discounted Cash Flow model estimates what a company is worth by projecting future cash the business can generate and then discounting those cash flows back to today in $ terms. For CSW Industrials, the 2 Stage Free Cash Flow to Equity model starts from last twelve month Free Cash Flow of about $142.6 million and forecasts how that figure could grow over time.
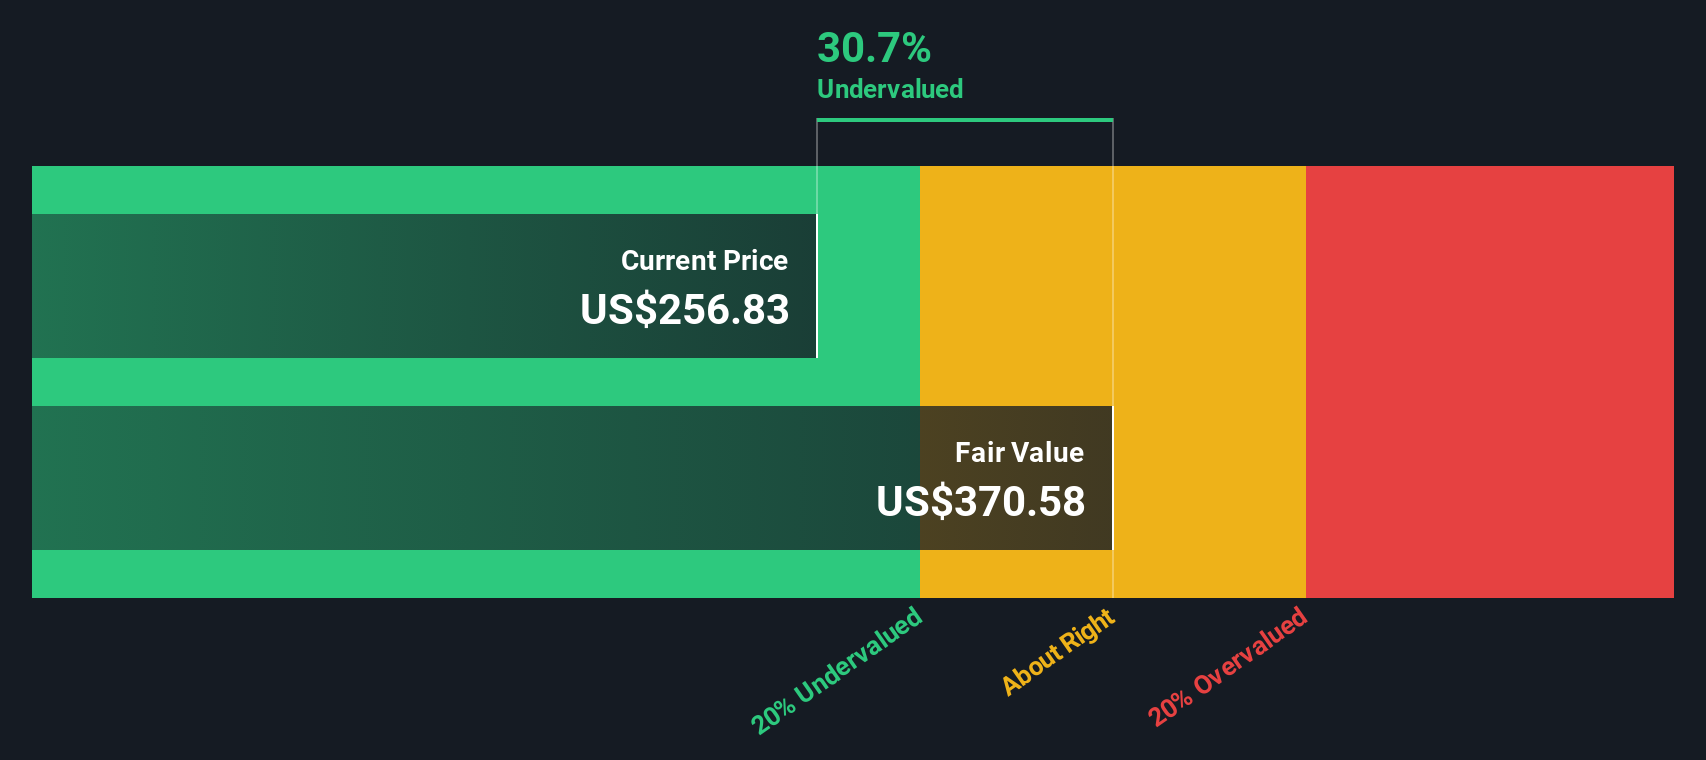
Analysts directly project Free Cash Flow out to 2027, where it is expected to reach roughly $199.8 million. Beyond that, Simply Wall St extrapolates the trend, with Free Cash Flow estimated to climb to about $268.7 million in 2035 as growth gradually slows. When all these future cash flows are discounted back to the present, the model arrives at an intrinsic value of around $234.17 per share.
With the stock trading near $305, the DCF suggests CSW Industrials is about 30.7% overvalued on this cash flow based view, which indicates that much of the expected growth may already be reflected in the current share price.
Result: OVERVALUED
Our Discounted Cash Flow (DCF) analysis suggests CSW Industrials may be overvalued by 30.7%. Discover 914 undervalued stocks or create your own screener to find better value opportunities.
Approach 2: CSW Industrials Price vs Earnings
For consistently profitable companies like CSW Industrials, the Price to Earnings ratio is a useful shorthand for how much investors are willing to pay for each dollar of current earnings. A higher PE can be associated with businesses that have strong, durable growth prospects and relatively low risk, while slower or more volatile companies typically trade on a lower, more conservative multiple.
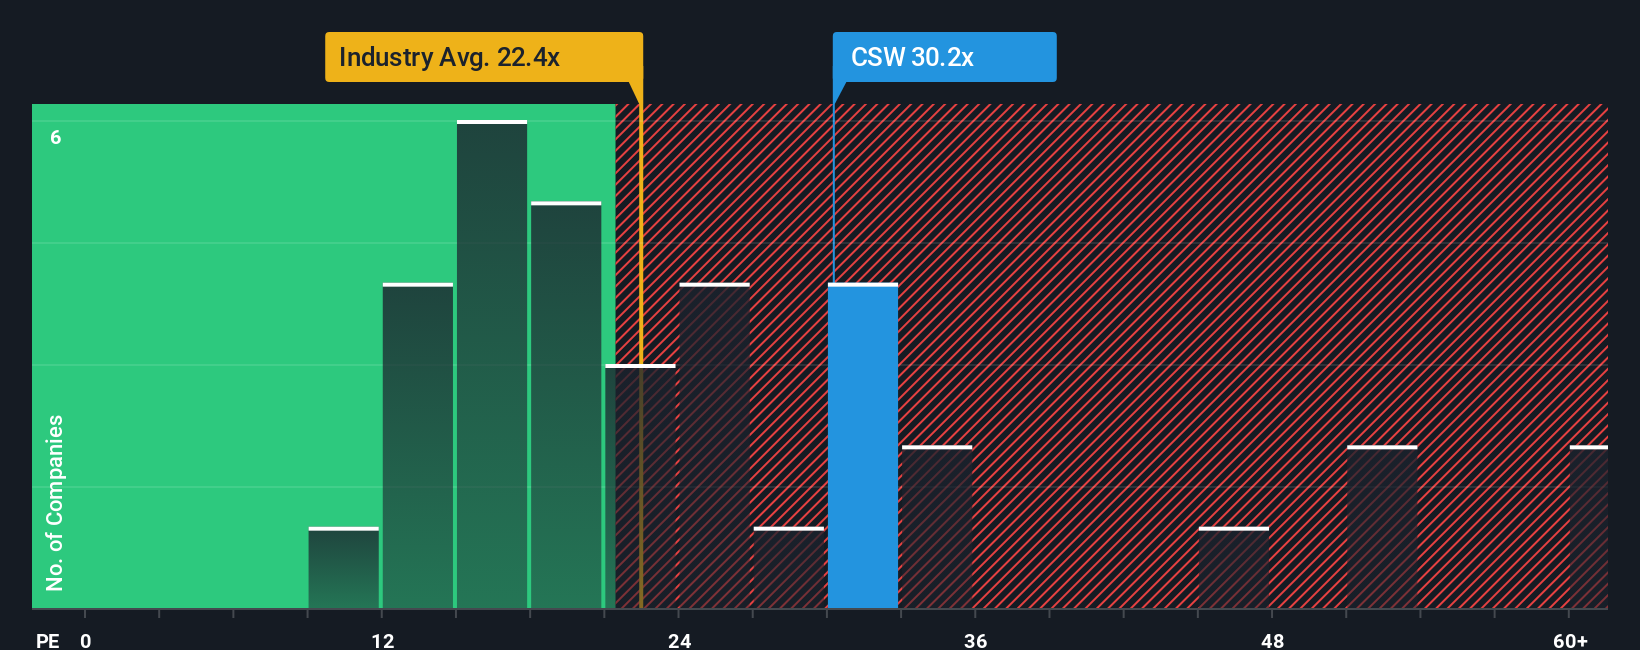
CSW Industrials currently trades on around 35.56x earnings, which is slightly below the peer group average of about 37.21x but well above the broader Building industry average of roughly 19.32x. To move beyond simple comparisons, Simply Wall St uses a proprietary Fair Ratio that estimates what a reasonable PE could be once factors like earnings growth, profitability, industry characteristics, market cap and risk profile are all considered. This can be more informative than just lining the stock up against peers or the sector, as it takes into account CSW Industrials specific characteristics.
On this basis, CSW Industrials Fair Ratio is estimated at 25.89x. The current 35.56x PE is therefore materially above this estimate of a fair multiple on this metric.
Result: OVERVALUED
PE ratios tell one story, but what if the real opportunity lies elsewhere? Discover 1465 companies where insiders are betting big on explosive growth.
Upgrade Your Decision Making: Choose your CSW Industrials Narrative
Earlier we mentioned that there is an even better way to understand valuation, so let us introduce you to Narratives, a simple way to connect your view of CSW Industrials with the numbers by telling a story about its future revenue, earnings and margins, then turning that into a financial forecast and a Fair Value you can compare with today’s share price.
On Simply Wall St’s Community page, millions of investors use Narratives as an easy tool to lay out their assumptions, see how those assumptions translate into a Fair Value, and decide whether the current price signals a buy, hold or sell, with the platform automatically updating their Narrative whenever new news, earnings or guidance comes in.
For example, one CSW Industrials Narrative might assume resilient HVAC demand, steady buybacks and manageable margin pressure, leading to a Fair Value around $340 and a “still undervalued” conclusion. A more cautious Narrative might focus on acquisition reliance, margin risk and housing cyclicality, producing a Fair Value closer to $269 and a “fully priced or overvalued” view at current levels.
Do you think there's more to the story for CSW Industrials? Head over to our Community to see what others are saying!

This article by Simply Wall St is general in nature. We provide commentary based on historical data and analyst forecasts only using an unbiased methodology and our articles are not intended to be financial advice. It does not constitute a recommendation to buy or sell any stock, and does not take account of your objectives, or your financial situation. We aim to bring you long-term focused analysis driven by fundamental data. Note that our analysis may not factor in the latest price-sensitive company announcements or qualitative material. Simply Wall St has no position in any stocks mentioned.
Have feedback on this article? Concerned about the content? Get in touch with us directly. Alternatively, email editorial-team@simplywallst.com