
Does AppLovin’s 7,231% Three Year Surge Still Make Sense in 2025?
- If you are wondering whether AppLovin is still a smart buy after its huge run or if you are late to the party, this breakdown will help you figure out what the current price actually implies about future growth.
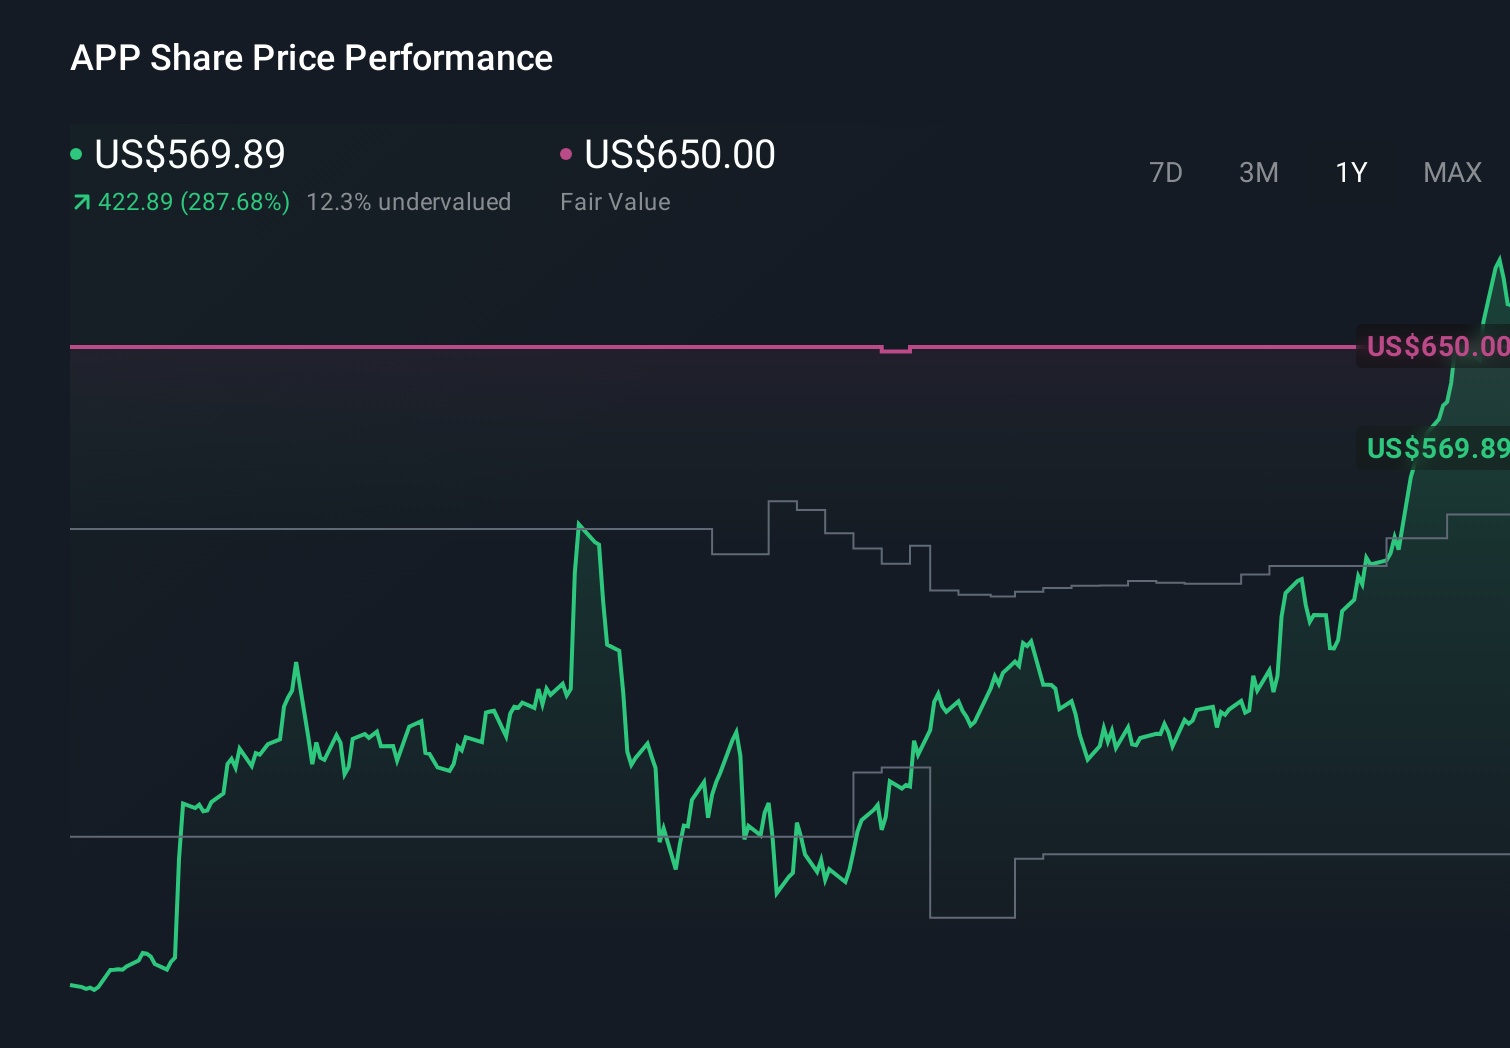
- The stock has surged 7.6% over the last week, 36.1% over the last month, and a massive 111.1% year to date, with a 111.6% gain over the past year and an eye catching 7,231.0% over three years. This naturally raises questions about how much upside is left versus how much risk has crept in.
- Much of this momentum has been driven by growing investor excitement around AppLovin's AXON ad engine and its positioning in performance based mobile advertising, as the market has warmed up to AI powered ad targeting and scaled ad networks again. In addition, broader enthusiasm for profitable software and ad tech platforms has pushed capital back into the sector, amplifying every piece of positive product and partnership news.
- Despite all that, AppLovin currently scores 0 out of 6 on our valuation checks, suggesting the market may already be pricing in a lot of good news. We will walk through different valuation approaches to see what the numbers really say, then finish with a more intuitive way to think about what this price implies for the company’s long term story.
AppLovin scores just 0/6 on our valuation checks. See what other red flags we found in the full valuation breakdown.
Approach 1: AppLovin Discounted Cash Flow (DCF) Analysis
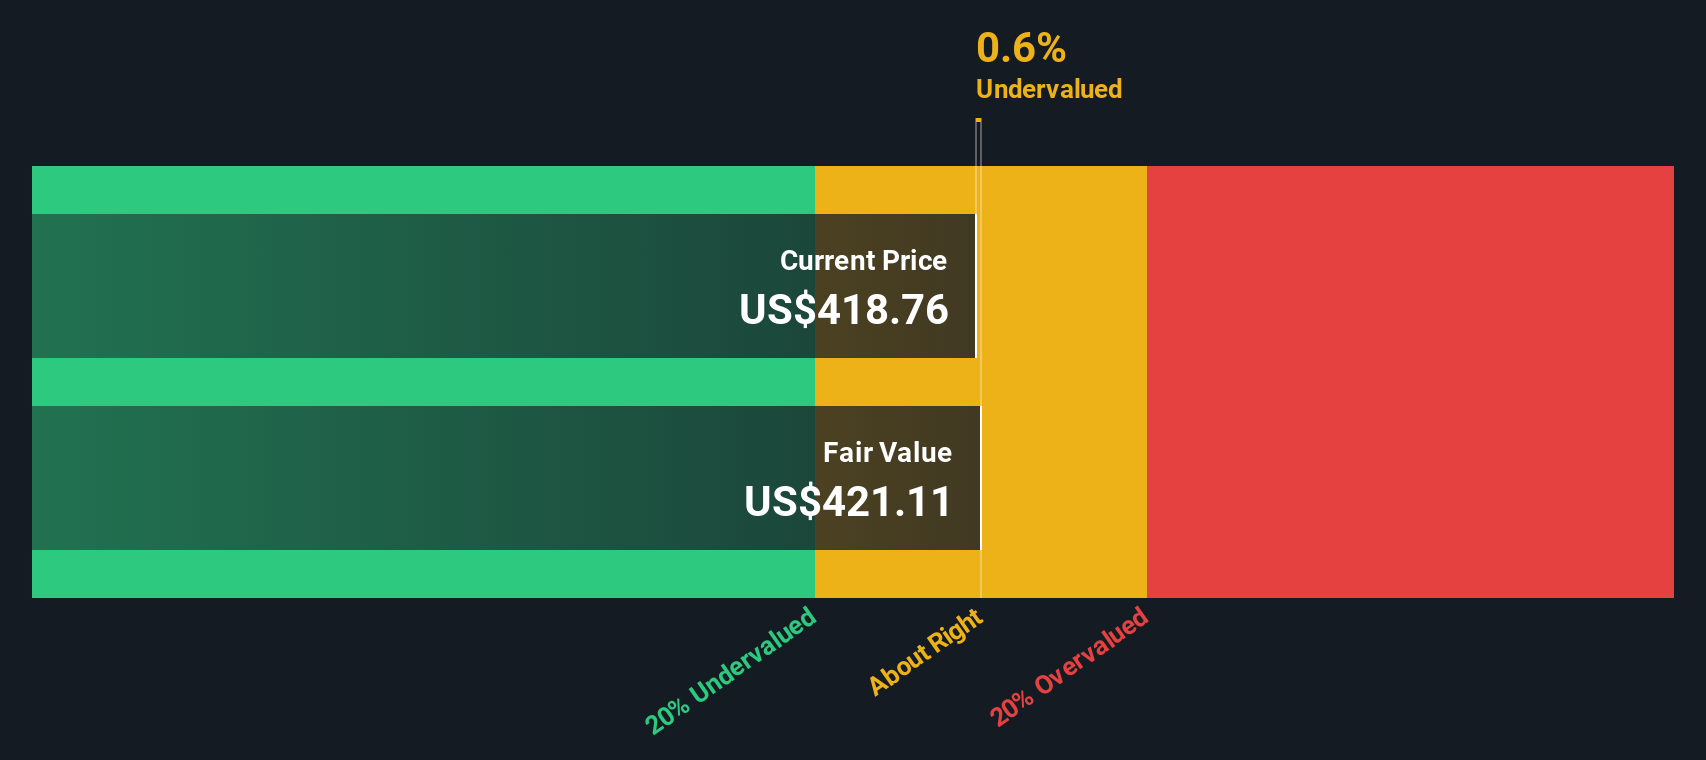
A Discounted Cash Flow model estimates what a business is worth by projecting the cash it can generate in the future and discounting those dollars back into today’s terms. For AppLovin, the model uses a 2 stage Free Cash Flow to Equity approach, grounded in its last twelve months of free cash flow of about $3.4 billion.
Analysts expect AppLovin’s free cash flow to keep rising, with projections of roughly $4.8 billion in 2026 and about $8.3 billion by 2029, before Simply Wall St extrapolates further growth out to 2035. All of these future cash flows, in dollars, are discounted back to arrive at an estimated intrinsic value of around $452 per share.
Comparing that intrinsic value to the current share price suggests the stock is about 59.6% above what the DCF model supports. This indicates that the market is already baking in very optimistic assumptions about growth and profitability.
Result: OVERVALUED
Our Discounted Cash Flow (DCF) analysis suggests AppLovin may be overvalued by 59.6%. Discover 914 undervalued stocks or create your own screener to find better value opportunities.
Approach 2: AppLovin Price vs Earnings
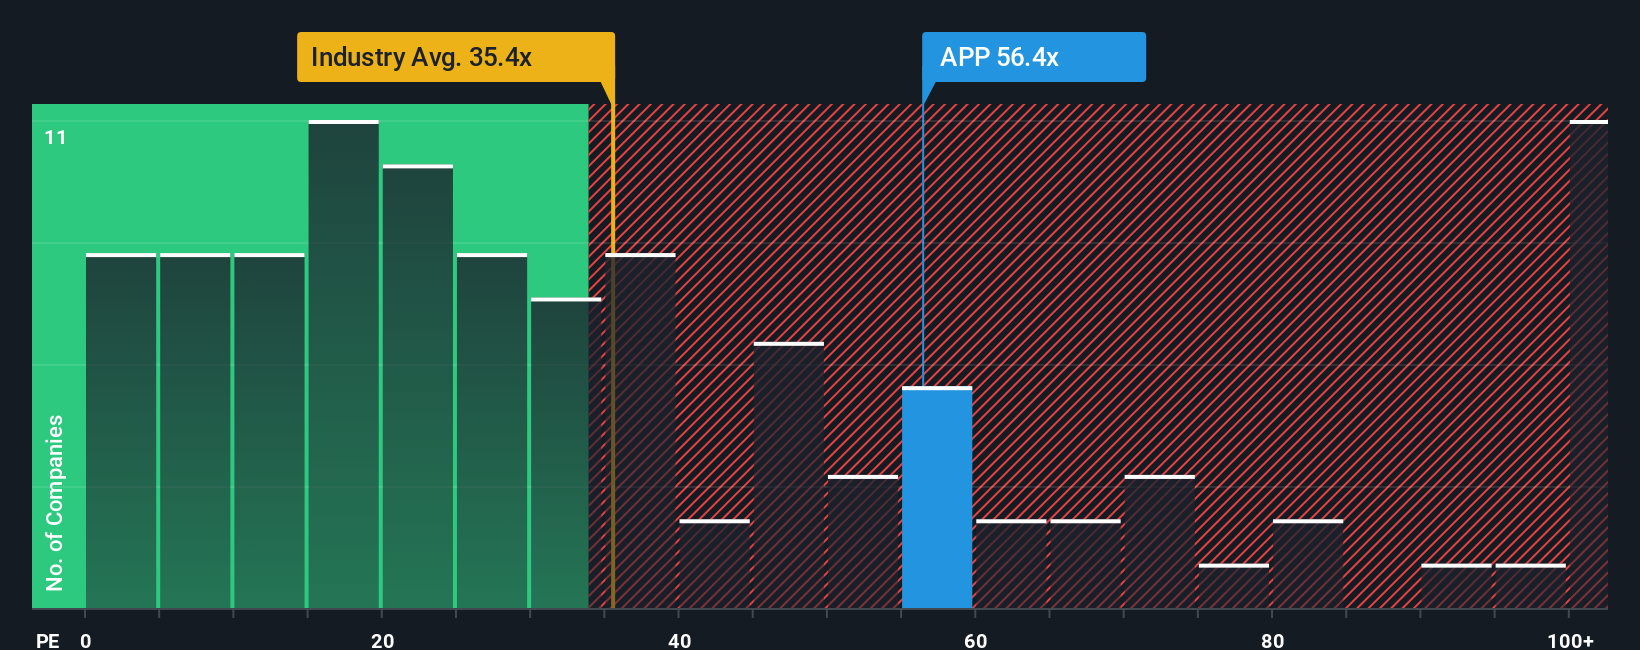
For profitable companies like AppLovin, the price to earnings ratio is a useful way to gauge how much investors are willing to pay today for each dollar of current profits. A higher PE can be justified when a business is growing quickly and its earnings are seen as relatively predictable. Slower or riskier companies usually command a lower, more conservative multiple.
AppLovin currently trades at about 83.6x earnings, which is well above both the broader Software industry average of roughly 32.4x and its peer group average of around 45.2x. On the surface, that kind of premium suggests very strong confidence in the company’s growth outlook and competitive position.
Simply Wall St’s Fair Ratio takes this a step further by estimating what PE multiple would be reasonable for AppLovin, given its earnings growth profile, margins, risk factors, industry dynamics and market cap. For AppLovin, the Fair Ratio is about 56.8x, meaning the stock is trading materially richer than what those fundamentals would normally support. That makes the Fair Ratio a more tailored benchmark than simple peer or industry comparisons. It currently points to a valuation that looks stretched rather than conservative.
Result: OVERVALUED
PE ratios tell one story, but what if the real opportunity lies elsewhere? Discover 1465 companies where insiders are betting big on explosive growth.
Upgrade Your Decision Making: Choose your AppLovin Narrative
Earlier we mentioned that there is an even better way to understand valuation, so let us introduce you to Narratives, a simple way to attach a story, your view of AppLovin’s future revenue, earnings and margins, to the numbers behind a fair value estimate. A Narrative connects three things: how you think the business will actually evolve, what that implies for a financial forecast, and the fair value that falls out of those assumptions. You can then compare that to today’s share price and decide whether the stock looks attractive or expensive. Narratives on Simply Wall St, available on the Community page that millions of investors already use, make this process easy and accessible. They update dynamically as fresh news, guidance or earnings arrive, so your view stays current without you rebuilding a spreadsheet each time. For example, one AppLovin Narrative might assume earnings climb toward the bullish end of analyst expectations and support a fair value closer to 737 dollars per share. A more cautious Narrative might lean toward the lower earnings path and land near 250 dollars per share, helping you quickly see which story you actually believe and how that compares to the market price.
Do you think there's more to the story for AppLovin? Head over to our Community to see what others are saying!
This article by Simply Wall St is general in nature. We provide commentary based on historical data and analyst forecasts only using an unbiased methodology and our articles are not intended to be financial advice. It does not constitute a recommendation to buy or sell any stock, and does not take account of your objectives, or your financial situation. We aim to bring you long-term focused analysis driven by fundamental data. Note that our analysis may not factor in the latest price-sensitive company announcements or qualitative material. Simply Wall St has no position in any stocks mentioned.
Have feedback on this article? Concerned about the content? Get in touch with us directly. Alternatively, email editorial-team@simplywallst.com