
Does Qualcomm’s 2025 Rally Still Leave Room for Further Upside Potential?
- Wondering if QUALCOMM is still a smart buy after its big run, or if most of the upside is already priced in? This article breaks down what the current share price really implies.
- The stock has slipped about 1.7% over the last week but is still up 5.5% in the past month, 14.1% year to date, and 17.2% over the last year, hinting at solid momentum despite short term volatility.
- That move has come as investors double down on the semiconductor and wireless infrastructure story, with QUALCOMM front and center in themes like advanced 5G connectivity, edge computing and AI enabled devices. The market has been re rating chipmakers tied to these structural trends, and QUALCOMM is increasingly being viewed as a key beneficiary rather than just a cyclical hardware name.
- On our checklist based valuation framework, QUALCOMM scores a 3/6 value score, suggesting pockets of undervaluation but also areas where the price looks full. Next, we will unpack what different valuation lenses say about that, before finishing with a more holistic way to think about what the stock is really worth.
Find out why QUALCOMM's 17.2% return over the last year is lagging behind its peers.
Approach 1: QUALCOMM Discounted Cash Flow (DCF) Analysis
A Discounted Cash Flow, or DCF, model estimates what a company is worth by projecting the cash it can generate in the future and then discounting those cash flows back to today in dollar terms.
For QUALCOMM, the model uses a 2 Stage Free Cash Flow to Equity approach, starting from last twelve months free cash flow of about $12.6 billion. Analyst forecasts underpin the next few years, with Simply Wall St extrapolating growth further out as cash flows mature. By 2030, free cash flow is projected to be roughly $18.4 billion, with a gradual slowdown in growth through the following years as the business scales.
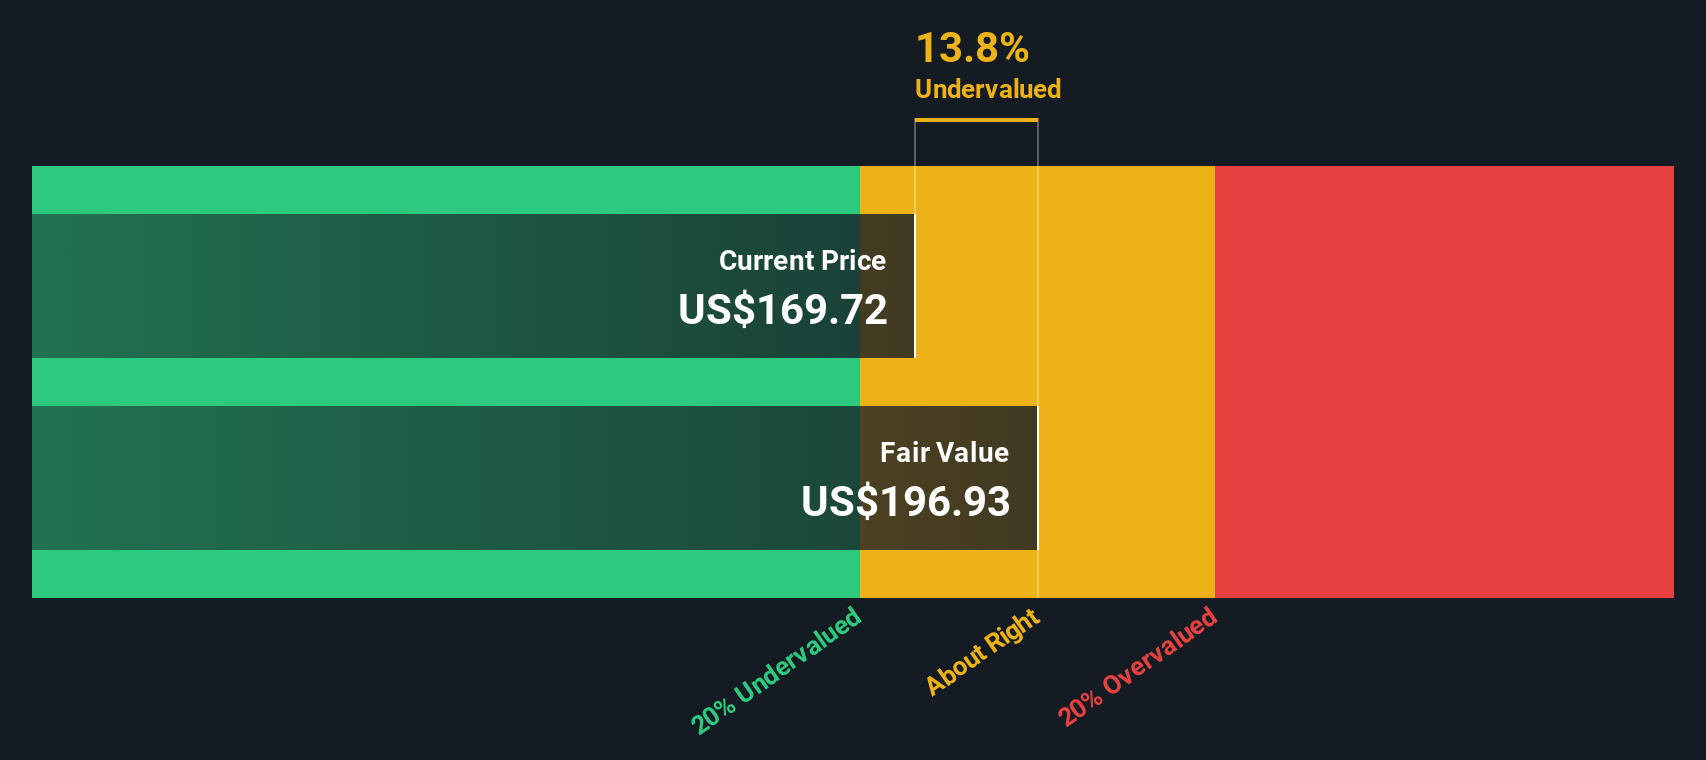
When all those projected cash flows are discounted back, the resulting intrinsic value is about $205.12 per share. Compared with the current share price, this implies roughly a 14.6% discount, which indicates that the market price is below this intrinsic value estimate based on the model’s assumptions about QUALCOMM’s long term cash generation potential.
Result: UNDERVALUED (according to this DCF model)
Our Discounted Cash Flow (DCF) analysis suggests QUALCOMM is undervalued by 14.6%. Track this in your watchlist or portfolio, or discover 914 more undervalued stocks based on cash flows.
Approach 2: QUALCOMM Price vs Earnings
For profitable, established companies like QUALCOMM, the price to earnings, or PE, ratio is often the cleanest way to see what investors are willing to pay for each dollar of current earnings. It naturally captures how the market is balancing near term profitability with expectations for future growth.
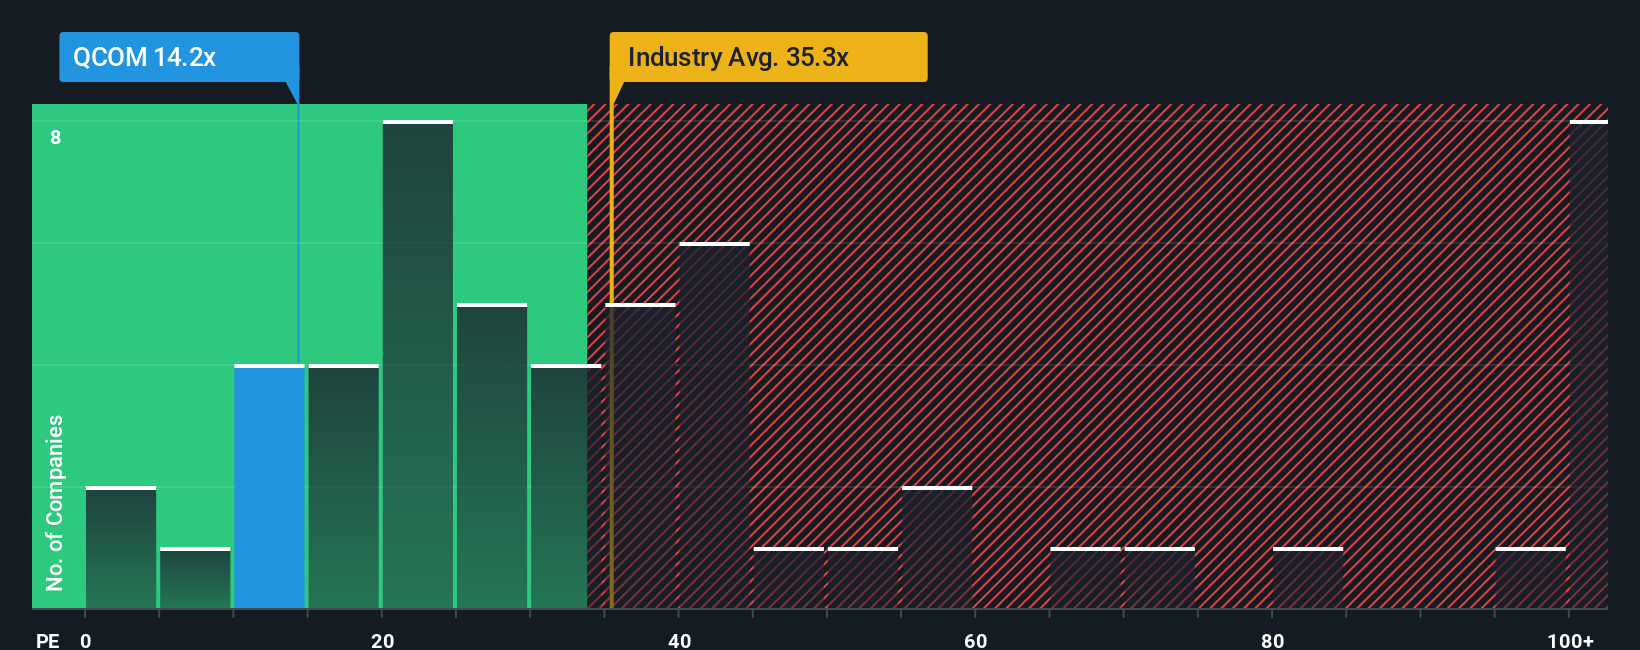
In general, faster growth and lower perceived risk justify a higher PE, while slower growth, cyclicality or elevated risks call for a lower multiple. QUALCOMM currently trades on a PE of about 33.6x, compared with the broader Semiconductor industry average of roughly 36.8x and a peer group sitting much higher at around 65.5x. That alone suggests the stock is not aggressively priced relative to its space.
Simply Wall St’s Fair Ratio framework goes a step further by estimating what PE QUALCOMM should trade on, given its earnings growth outlook, margins, risk profile, industry positioning and size. That model points to a Fair Ratio of about 33.3x, which is very close to the current 33.6x. On this lens, the stock looks broadly in line with what its fundamentals justify.
Result: ABOUT RIGHT
PE ratios tell one story, but what if the real opportunity lies elsewhere? Discover 1465 companies where insiders are betting big on explosive growth.
Upgrade Your Decision Making: Choose your QUALCOMM Narrative
Earlier we mentioned that there is an even better way to understand valuation, so let us introduce you to Narratives, a simple way to connect the story you believe about QUALCOMM with the numbers behind its future revenue, earnings, margins and ultimately its fair value. A Narrative on Simply Wall St is your own investment storyline that links what you think will happen in QUALCOMM’s business, for example how fast its Edge AI, automotive and IoT segments grow, to a financial forecast and then to a fair value estimate that you can directly compare with today’s share price to help inform whether you want to buy, hold or sell. Narratives are available on the Simply Wall St Community page and are used by millions of investors. They update dynamically as new information like earnings results or major news arrives, so your view stays current without you needing to rebuild models from scratch. For QUALCOMM today, one bullish Narrative might see fair value closer to about $300 per share based on strong AI and automotive traction, while a more cautious Narrative might sit nearer $192. Putting your own Narrative alongside those ranges helps you quickly see where you differ and what that implies for your decision.
Do you think there's more to the story for QUALCOMM? Head over to our Community to see what others are saying!

This article by Simply Wall St is general in nature. We provide commentary based on historical data and analyst forecasts only using an unbiased methodology and our articles are not intended to be financial advice. It does not constitute a recommendation to buy or sell any stock, and does not take account of your objectives, or your financial situation. We aim to bring you long-term focused analysis driven by fundamental data. Note that our analysis may not factor in the latest price-sensitive company announcements or qualitative material. Simply Wall St has no position in any stocks mentioned.
Have feedback on this article? Concerned about the content? Get in touch with us directly. Alternatively, email editorial-team@simplywallst.com