
Is It Too Late To Consider Boot Barn After Its Huge Multi Year Share Price Run?
- If you are wondering whether Boot Barn Holdings is still attractive after its huge run, you are not alone. This is exactly the kind of stock where valuation really matters.
- The share price has pulled back about 6.6% over the last week, but it is still up 8.9% over the past month, 25.2% year to date, and 372.1% over five years, which indicates that the long-term story has been very rewarding for patient investors.
- Recent attention has centered on Boot Barn expanding its national footprint and continuing to lean into Western lifestyle trends. This keeps it in the conversation as a structural growth play. At the same time, analysts and investors have been debating whether the current growth expectations already fully justify the rally, particularly after such a strong multi-year move.
- Despite that enthusiasm, Boot Barn currently scores just 0/6 on our valuation checks, suggesting the stock screens as more expensive than cheap on traditional metrics. Next, we will break down what those different valuation approaches are really saying about BOOT, and then finish with a more nuanced way to think about what the stock might be worth.
Boot Barn Holdings scores just 0/6 on our valuation checks. See what other red flags we found in the full valuation breakdown.
Approach 1: Boot Barn Holdings Discounted Cash Flow (DCF) Analysis
A Discounted Cash Flow model estimates what a company is worth by projecting its future cash flows and then discounting those back to today in dollar terms. For Boot Barn Holdings, the model uses a 2 Stage Free Cash Flow to Equity approach, starting from last twelve month Free Cash Flow of about $58.2 million and then layering on analyst forecasts and longer term extrapolations.
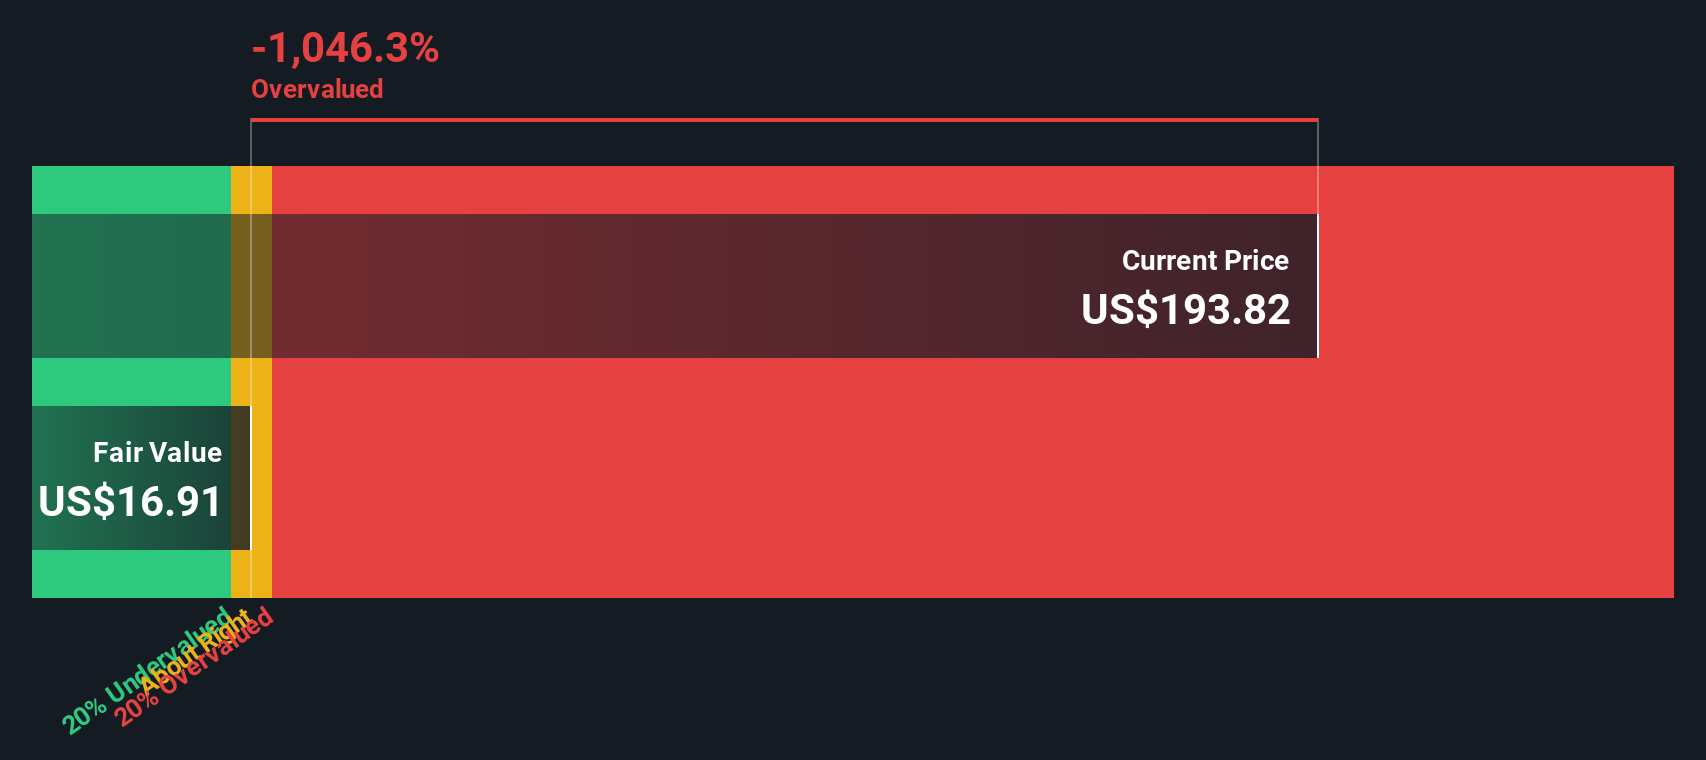
Analysts expect Free Cash Flow to rise to roughly $119.1 million in 2026 and $125.5 million in 2027, before moderating to a projected $21.9 million in 2035, with values beyond the explicit analyst window extrapolated by Simply Wall St. When all those future cash flows are discounted back to today, the model arrives at an intrinsic value of about $16.57 per share.
Compared to the current share price, this implies the stock is about 1053.5% above its DCF based fair value. On this cash flow measure, Boot Barn appears materially overvalued.
Result: OVERVALUED
Our Discounted Cash Flow (DCF) analysis suggests Boot Barn Holdings may be overvalued by 1053.5%. Discover 914 undervalued stocks or create your own screener to find better value opportunities.
Approach 2: Boot Barn Holdings Price vs Earnings
For a profitable retailer like Boot Barn, the price to earnings ratio is a natural way to judge valuation because it directly links what investors pay today to the company’s current earnings power. In general, faster expected growth and lower risk justify a higher PE, while slower growth or higher uncertainty argue for a lower, more conservative multiple.
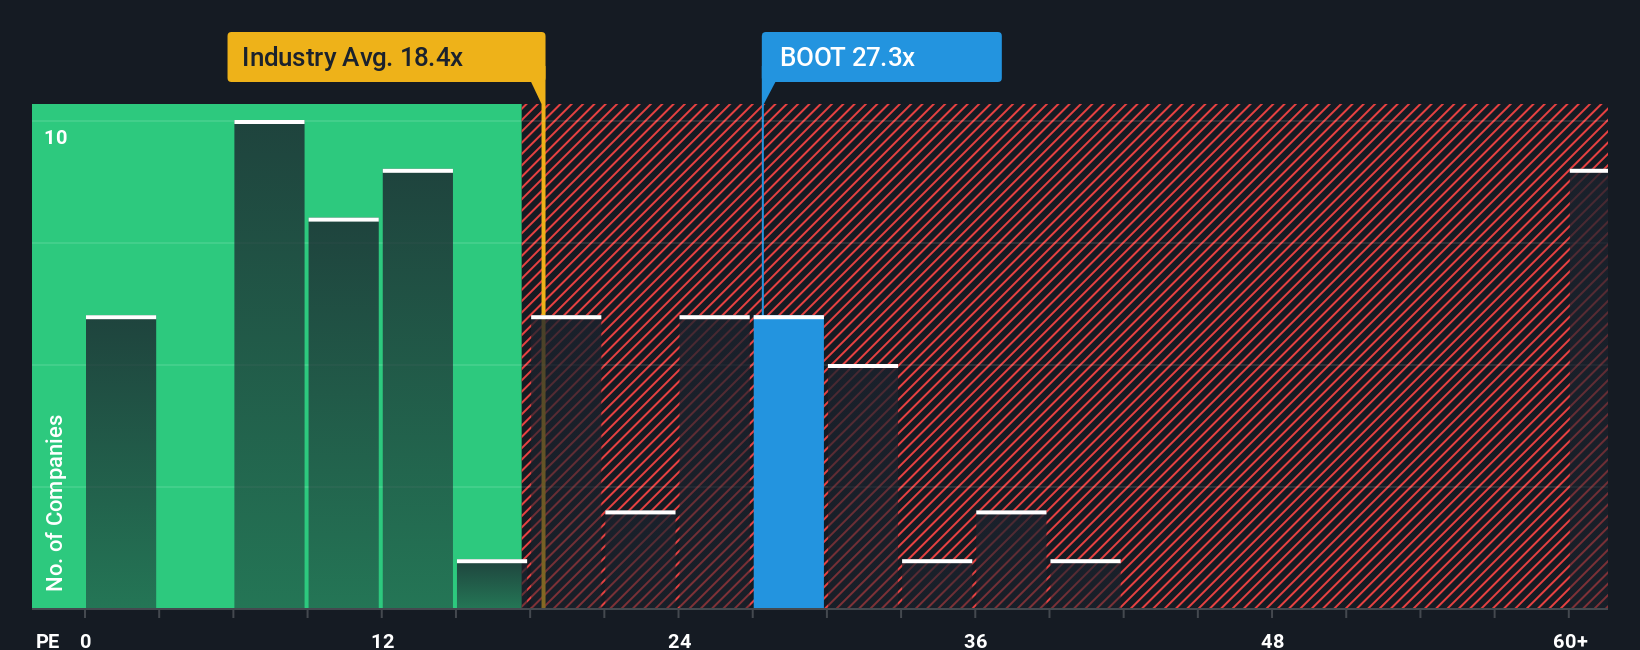
Boot Barn currently trades at about 27.98x earnings, which is above both the Specialty Retail industry average of roughly 20.26x and the peer group average of around 18.74x. On the surface, that premium suggests the market is already pricing in stronger growth or a higher quality business than its competitors.
Simply Wall St’s Fair Ratio framework goes a step further by estimating what PE a stock should trade at given its specific earnings growth outlook, profitability, industry, market cap and risk profile. For Boot Barn, this Fair Ratio is about 18.37x, notably below the current 27.98x. Because this tailored benchmark incorporates more of the company’s fundamentals than a simple peer or industry comparison, it provides a clearer view of valuation. It indicates that Boot Barn’s shares are trading at a premium to what its fundamentals would typically warrant.
Result: OVERVALUED
PE ratios tell one story, but what if the real opportunity lies elsewhere? Discover 1464 companies where insiders are betting big on explosive growth.
Upgrade Your Decision Making: Choose your Boot Barn Holdings Narrative
Earlier we mentioned that there is an even better way to understand valuation, so let us introduce you to Narratives, which are simply the stories investors tell about a company that link its business outlook to a concrete forecast for revenue, earnings and margins and then to a fair value estimate. Narratives on Simply Wall St’s Community page, used by millions of investors, make this process easy and accessible by guiding you to spell out your assumptions, translate them into a financial model, and then compare the resulting Fair Value to the current share price so you can decide whether you think Boot Barn is a buy, hold, or sell. Because these Narratives are dynamically updated as new information like earnings, news, or guidance arrives, they stay aligned with the latest data rather than becoming stale opinions. For example, one Boot Barn Narrative might assume that strong same store sales and continued store expansion justify a fair value close to the most bullish analyst target of about $254 per share, while a more cautious Narrative, focused on execution and fashion risks, might align nearer the most bearish target of roughly $142 per share.
Do you think there's more to the story for Boot Barn Holdings? Head over to our Community to see what others are saying!
This article by Simply Wall St is general in nature. We provide commentary based on historical data and analyst forecasts only using an unbiased methodology and our articles are not intended to be financial advice. It does not constitute a recommendation to buy or sell any stock, and does not take account of your objectives, or your financial situation. We aim to bring you long-term focused analysis driven by fundamental data. Note that our analysis may not factor in the latest price-sensitive company announcements or qualitative material. Simply Wall St has no position in any stocks mentioned.
Have feedback on this article? Concerned about the content? Get in touch with us directly. Alternatively, email editorial-team@simplywallst.com