
Has Lilly’s Obesity Drug Breakthrough Left Enough Upside After a 577% Five Year Surge?
- If you are wondering whether Eli Lilly is still worth buying after its massive run up, or if the market has already priced in all the good news, you are not alone.
- The stock has climbed 4.3% over the last week, 37.7% year to date, and an enormous 577.5% over five years. This naturally raises questions about how much upside is really left from here.
- Recent gains have been driven largely by excitement around Eli Lilly's leadership in obesity and diabetes treatments, with blockbuster demand for its GLP 1 drugs reshaping expectations for long term revenue. In addition, ongoing pipeline developments in areas like Alzheimer's and oncology have reinforced the idea that Lilly is building a broad, durable growth engine rather than a single product story.
- Despite all that optimism, Lilly only scores 1 out of 6 on our undervaluation checks. In the rest of this article we will explore different valuation approaches to see whether the price still makes sense, and then finish with a more nuanced way to think about valuation that goes beyond the usual multiples and models.
Eli Lilly scores just 1/6 on our valuation checks. See what other red flags we found in the full valuation breakdown.
Approach 1: Eli Lilly Discounted Cash Flow (DCF) Analysis
A Discounted Cash Flow, or DCF, model estimates what a company is worth by projecting the cash it can generate in the future and then discounting those cash flows back into today’s dollars.
For Eli Lilly, the latest twelve month free cash flow is about $6.2 Billion. Analysts and modelled estimates see this growing strongly, with projected free cash flow reaching roughly $60.3 Billion by 2035 based on a two stage Free Cash Flow to Equity model. Near term forecasts out to 2029, where free cash flow is expected to be around $37.6 Billion, are based on analyst estimates, while the subsequent years are extrapolated by Simply Wall St from those growth trends.
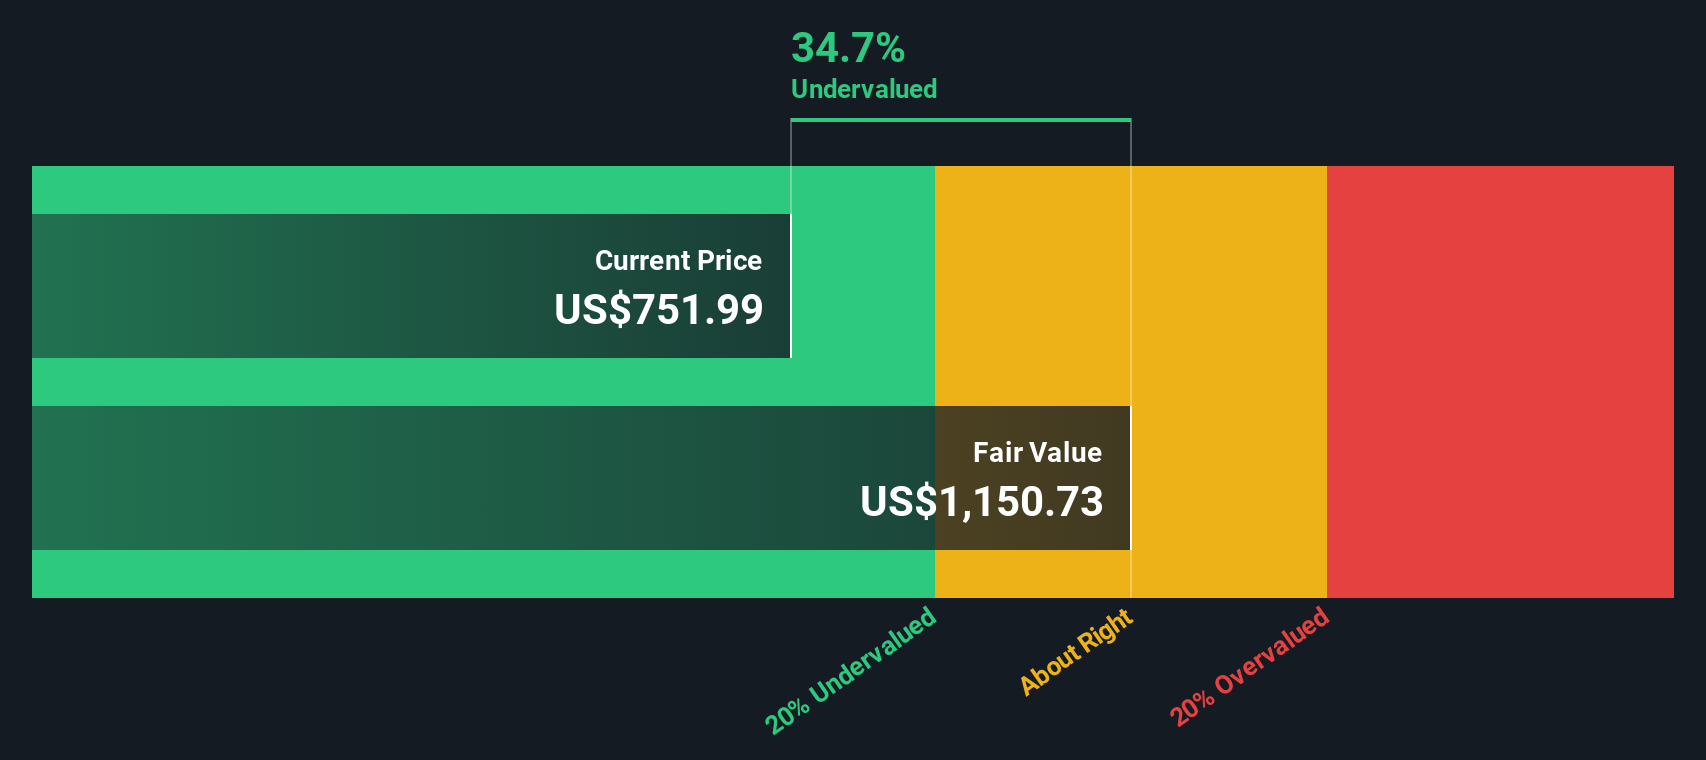
When all these future cash flows are discounted back to today, the model arrives at an intrinsic value of about $1,274.08 per share. Compared to the current share price, this implies the stock is 15.9% undervalued, which indicates that, on cash flow fundamentals alone, the market may still be underestimating Lilly’s long term earnings power.
Result: UNDERVALUED
Our Discounted Cash Flow (DCF) analysis suggests Eli Lilly is undervalued by 15.9%. Track this in your watchlist or portfolio, or discover 913 more undervalued stocks based on cash flows.
Approach 2: Eli Lilly Price vs Earnings
For profitable companies like Eli Lilly, the price to earnings, or PE, ratio is a useful way to gauge how much investors are willing to pay for each dollar of current earnings. In general, higher growth and lower perceived risk justify a higher PE, while slower or uncertain growth usually warrants a more modest multiple.
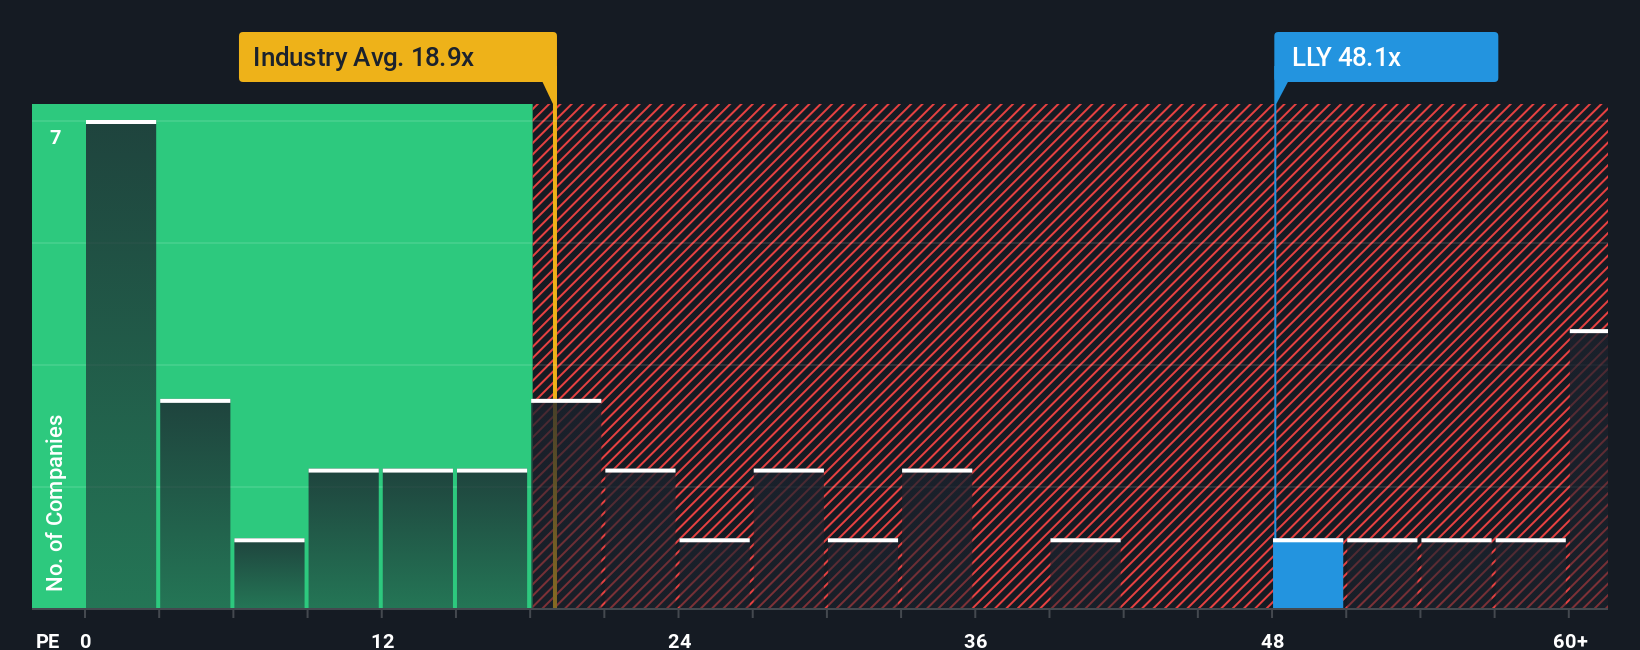
Eli Lilly currently trades on a PE of about 52.1x, which is far above both the Pharmaceuticals industry average of roughly 19.8x and the broader peer average of around 16.5x. On simple comparisons, that makes the stock look very expensive. However, these basic benchmarks do not fully reflect Lilly’s earnings growth prospects, margins or large scale.
Simply Wall St’s Fair Ratio metric attempts to address this by estimating what a “normal” PE should be after considering the company’s growth outlook, profitability, risk profile, industry and market cap. For Eli Lilly, the Fair Ratio is around 43.8x, which still implies a premium valuation but one that is supported by fundamentals. Since the current PE of 52.1x sits meaningfully above this level, the stock screens as overvalued on a PE basis.
Result: OVERVALUED
PE ratios tell one story, but what if the real opportunity lies elsewhere? Discover 1463 companies where insiders are betting big on explosive growth.
Upgrade Your Decision Making: Choose your Eli Lilly Narrative
Earlier we mentioned that there is an even better way to understand valuation, so let us introduce you to Narratives, a simple framework where you spell out your story about a company and link that story to specific forecasts for revenue, earnings, margins and, ultimately, a fair value estimate.
On Simply Wall St’s Community page, Narratives are easy to build and follow. They help you connect what you believe about Eli Lilly’s future, such as GLP 1 demand, pricing power or regulatory risk, to a clear financial model that outputs a Fair Value you can compare against the current share price to inform whether you buy, hold or sell.
Because Narratives are dynamic and update as new information such as earnings, drug approvals or policy changes arrives, they help you avoid relying on stale assumptions and instead keep your investment decisions aligned with the latest data and your evolving view of the business.
For example, one Eli Lilly Narrative on the platform assumes strong GLP 1 growth and sees fair value near $1,189 per share, while a more conservative Narrative, factoring in pricing and policy risks, points closer to $891. This shows how different investors can reasonably arrive at very different conclusions from the same starting data.
For Eli Lilly however we will make it really easy for you with previews of two leading Eli Lilly Narratives:
Fair value: $1,189.18
Implied undervaluation vs last close: -1.6%
Assumed revenue growth: 20%
- The GLP 1 franchise, particularly Mounjaro and Zepbound, is expected to drive rapid revenue growth as supply constraints ease and penetration rises from a low single digit share of the addressable U.S. population.
- Strong patent protection on tirzepatide into the mid 2030s and improving insurance coverage are seen as key supports for durable pricing and margin expansion.
- Risks center on high drug prices, potential side effects, execution on new manufacturing capacity and the elevated current PE, but the narrative concludes that current growth justifies a fair value near $1,200.
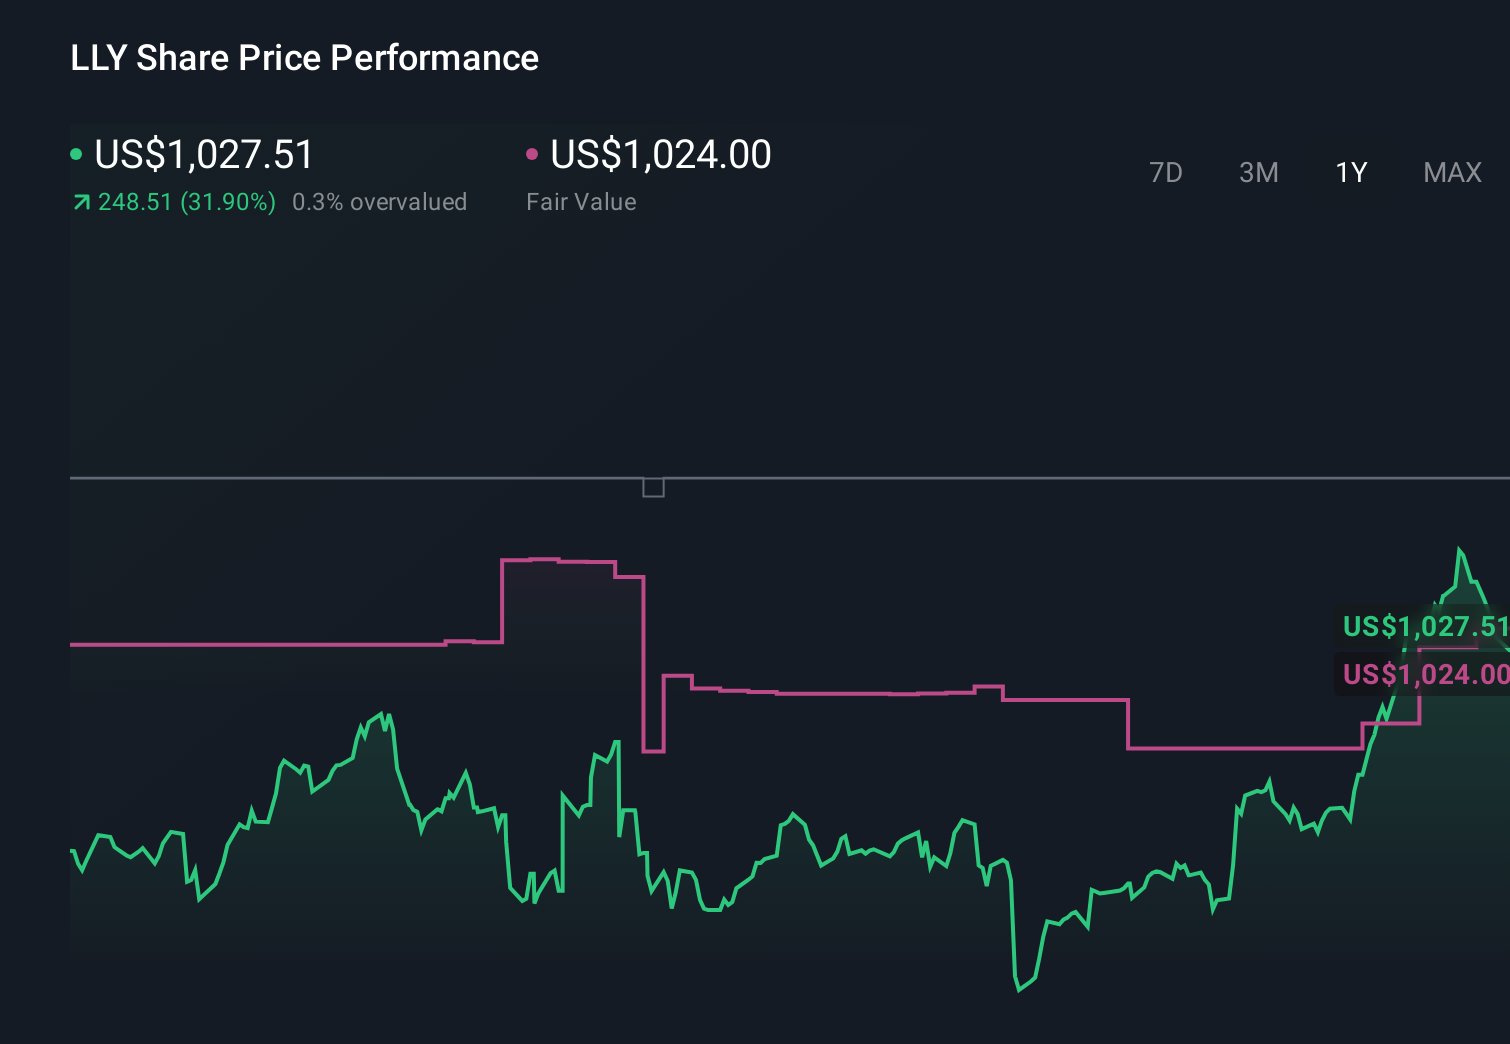
Fair value: $1,024.00
Implied overvaluation vs last close: 4.6%
Assumed revenue growth: 17.48%
- Analyst consensus expects strong earnings growth from obesity and diabetes drugs and an expanding specialty pipeline, but assumes valuation multiples compress from today’s very high PE levels.
- The narrative highlights material risks from pricing and reimbursement pressure, concentration in a small set of blockbuster GLP 1 products and rising competition, including discounted and generic alternatives.
- With a fair value estimate close to $1,024 and current price above that level, the narrative frames Lilly as a high quality leader where much of the good news may already be priced in.
Do you think there's more to the story for Eli Lilly? Head over to our Community to see what others are saying!
This article by Simply Wall St is general in nature. We provide commentary based on historical data and analyst forecasts only using an unbiased methodology and our articles are not intended to be financial advice. It does not constitute a recommendation to buy or sell any stock, and does not take account of your objectives, or your financial situation. We aim to bring you long-term focused analysis driven by fundamental data. Note that our analysis may not factor in the latest price-sensitive company announcements or qualitative material. Simply Wall St has no position in any stocks mentioned.
Have feedback on this article? Concerned about the content? Get in touch with us directly. Alternatively, email editorial-team@simplywallst.com