
Is It Too Late To Consider Celestica After Its 203% Surge In 2025?
- If you are wondering whether Celestica is still worth buying after its huge run, you are not alone. This breakdown will help you judge whether the current price still makes sense.
- The stock is up an eye catching 203.4% year to date and 197.5% over the last year, even after a recent pullback of 3.4% in the last week and 7.4% over the past month. This naturally raises questions about upside versus downside from here.
- Behind those moves, investors have been reacting to Celestica winning new contracts in high value areas like cloud infrastructure and advanced manufacturing, while also sharpening its focus on higher margin design and engineering services. At the same time, growing attention on reshoring and supply chain resilience has put companies like Celestica in the spotlight as potential long term beneficiaries.
- Despite that enthusiasm, Celestica only scores a 2/6 valuation check score, suggesting that on several traditional measures it may already be pricing in a lot of good news. We will walk through those different valuation angles next and then finish with a more holistic way to think about what the stock is really worth.
Celestica scores just 2/6 on our valuation checks. See what other red flags we found in the full valuation breakdown.
Approach 1: Celestica Discounted Cash Flow (DCF) Analysis
A Discounted Cash Flow model estimates what a company is worth by projecting its future cash flows and then discounting them back to today, adjusting for risk and the time value of money.
Celestica generated about $379.5 Million in free cash flow over the last twelve months. Analyst forecasts and extrapolations suggest this could rise to roughly $701.2 Million by 2035, with intermediate projections such as $520.3 Million in 2026 and $651 Million in 2028. Simply Wall St uses a two stage Free Cash Flow to Equity model that combines these analyst estimates for the next few years with longer term growth assumptions to build a ten year cash flow path in $.
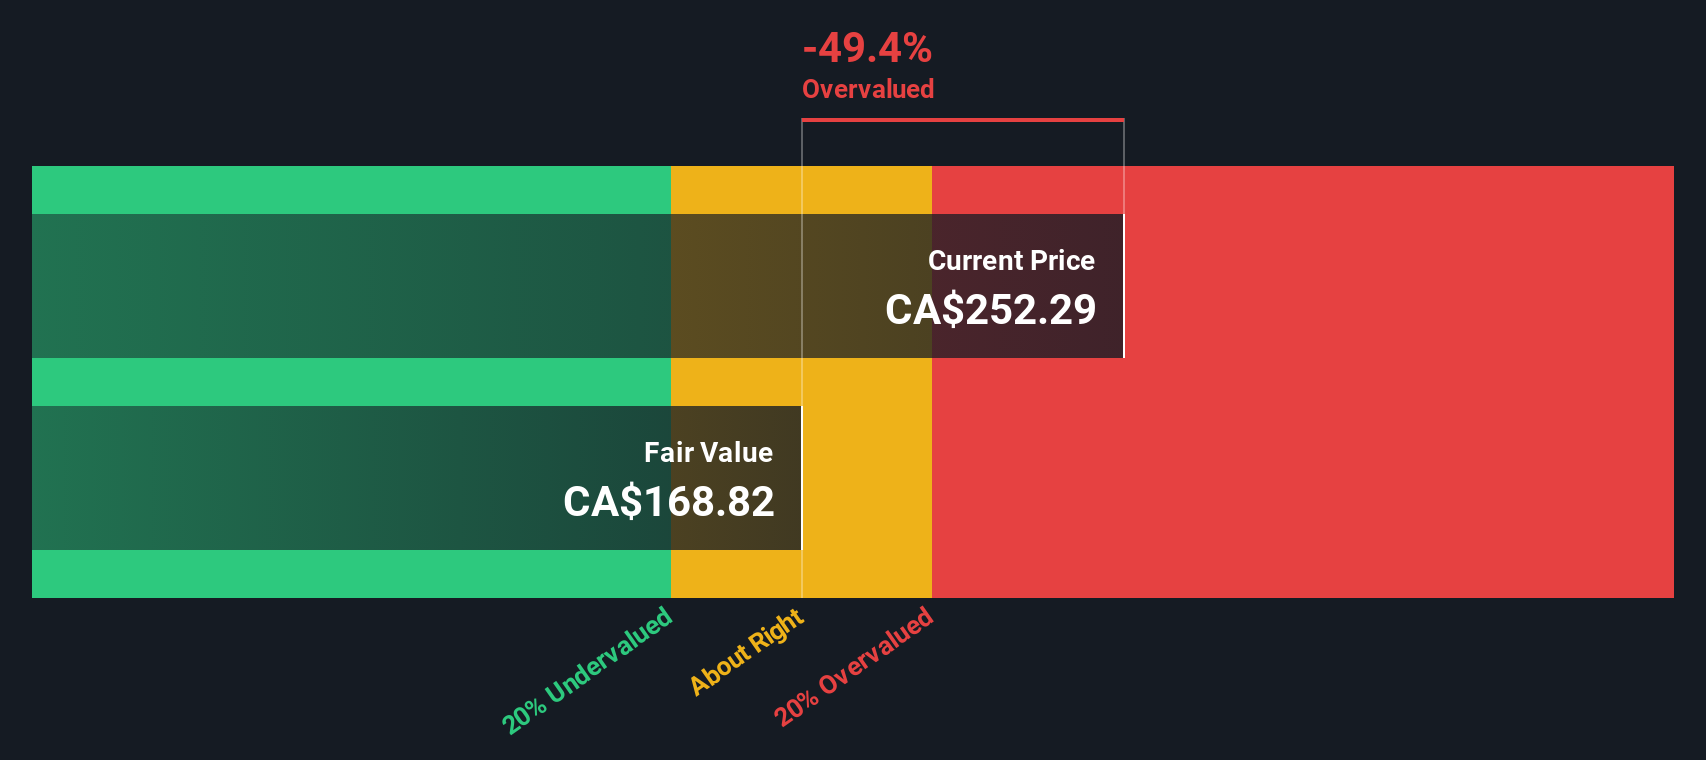
When all those future cash flows are discounted back to the present, the model estimates an intrinsic value of about $142.09 per share. Compared with the current market price, that implies the stock is roughly 186.7% above this model-derived value, indicating that expectations in the share price are well ahead of the modeled cash generation.
Result: OVERVALUED
Our Discounted Cash Flow (DCF) analysis suggests Celestica may be overvalued by 186.7%. Discover 913 undervalued stocks or create your own screener to find better value opportunities.
Approach 2: Celestica Price vs Earnings
For profitable companies like Celestica, the price to earnings (PE) ratio is a practical way to gauge whether investors are paying a reasonable price for each dollar of current earnings. In general, faster growth and lower perceived risk can justify a higher PE, while slower growth or greater uncertainty usually call for a lower multiple.
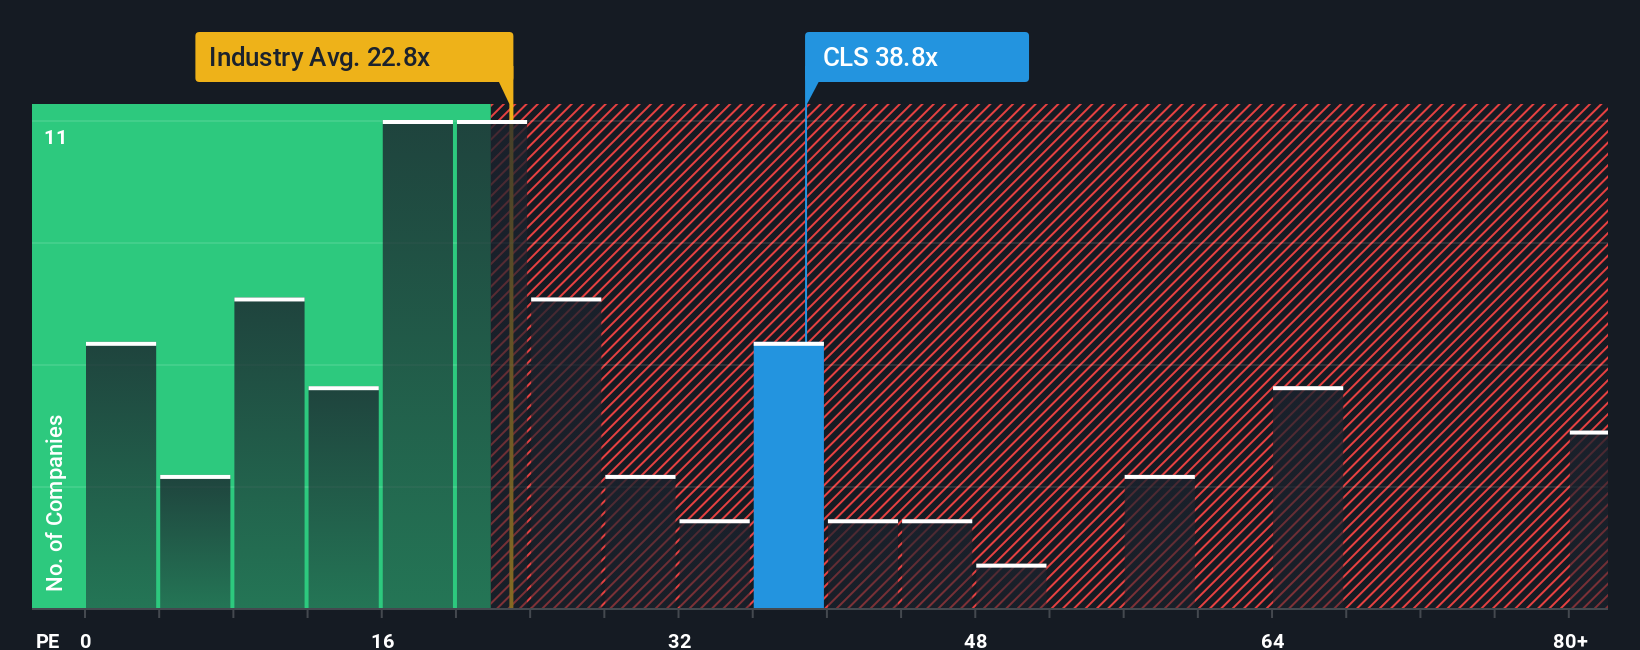
Celestica currently trades on a PE of about 47.4x, which is well above both the Electronic industry average of roughly 25.4x and the peer group average of around 32.8x. At first glance, that premium suggests the market is already factoring in strong growth and solid execution.
Simply Wall St’s Fair Ratio framework refines this comparison by estimating what PE Celestica should trade on, given its specific earnings growth profile, profitability, size, industry and risk factors. For Celestica, this Fair Ratio comes out at about 47.7x, which is almost identical to the current market multiple. That makes it a more tailored yardstick than simple peer or industry comparisons and implies the present valuation is broadly in line with what its fundamentals justify.
Result: ABOUT RIGHT
PE ratios tell one story, but what if the real opportunity lies elsewhere? Discover 1463 companies where insiders are betting big on explosive growth.
Upgrade Your Decision Making: Choose your Celestica Narrative
Earlier we mentioned that there is an even better way to understand valuation. Let us introduce you to Narratives, a simple way to connect your view of Celestica’s future to a clear financial forecast and fair value. This is built directly inside Simply Wall St’s Community, where millions of investors outline the story they see for revenue, earnings and margins, and then compare the resulting Fair Value to today’s Price to decide whether to buy, hold or sell. These Narratives automatically update as new news or earnings arrive. For example, one Celestica investor might lean into an AI and hyperscaler boom story with rising margins and a fair value well above the current price, while another might focus on customer concentration and execution risks, assume slower growth and a lower future PE multiple, and therefore arrive at a much lower fair value and a more cautious stance.
Do you think there's more to the story for Celestica? Head over to our Community to see what others are saying!

This article by Simply Wall St is general in nature. We provide commentary based on historical data and analyst forecasts only using an unbiased methodology and our articles are not intended to be financial advice. It does not constitute a recommendation to buy or sell any stock, and does not take account of your objectives, or your financial situation. We aim to bring you long-term focused analysis driven by fundamental data. Note that our analysis may not factor in the latest price-sensitive company announcements or qualitative material. Simply Wall St has no position in any stocks mentioned.
Have feedback on this article? Concerned about the content? Get in touch with us directly. Alternatively, email editorial-team@simplywallst.com