
Is Novo Nordisk Attractively Priced After Sharp 2025 Share Price Pullback?
- If you are wondering whether Novo Nordisk is still worth buying after its blockbuster run in recent years, you are not alone. This article will walk through whether the current price really makes sense.
- Despite long term gains of 47.2% over five years, the stock has pulled back recently, with returns of -4.2% over the last week, -1.9% over the last month, and a much steeper -45.1% year to date.
- These moves come as investors weigh Novo Nordisk's continued dominance in diabetes and obesity treatments, including its flagship GLP 1 drugs that have reshaped expectations for growth in the sector. At the same time, renewed debate around drug pricing, competitive pipelines, and regulatory scrutiny has injected more uncertainty into what was once seen as a one way growth story.
- Right now, Novo Nordisk scores a 5 out of 6 on our valuation checks, suggesting it still looks undervalued on most metrics. We will break down what different valuation approaches are saying and then finish with a more holistic way to think about its true worth.
Find out why Novo Nordisk's -42.3% return over the last year is lagging behind its peers.
Approach 1: Novo Nordisk Discounted Cash Flow (DCF) Analysis
A Discounted Cash Flow, or DCF, model estimates what a company is worth today by forecasting the cash it can generate in the future and then discounting those cash flows back to their value in today’s money.
Novo Nordisk currently generates trailing twelve month free cash flow of about DKK 67.6 billion, and analysts expect this to rise steadily as demand for its diabetes and obesity treatments grows. Based on a two stage Free Cash Flow to Equity model, analyst forecasts cover the next few years, while Simply Wall St extrapolates further out, with free cash flow projected to reach roughly DKK 210.7 billion by 2035.
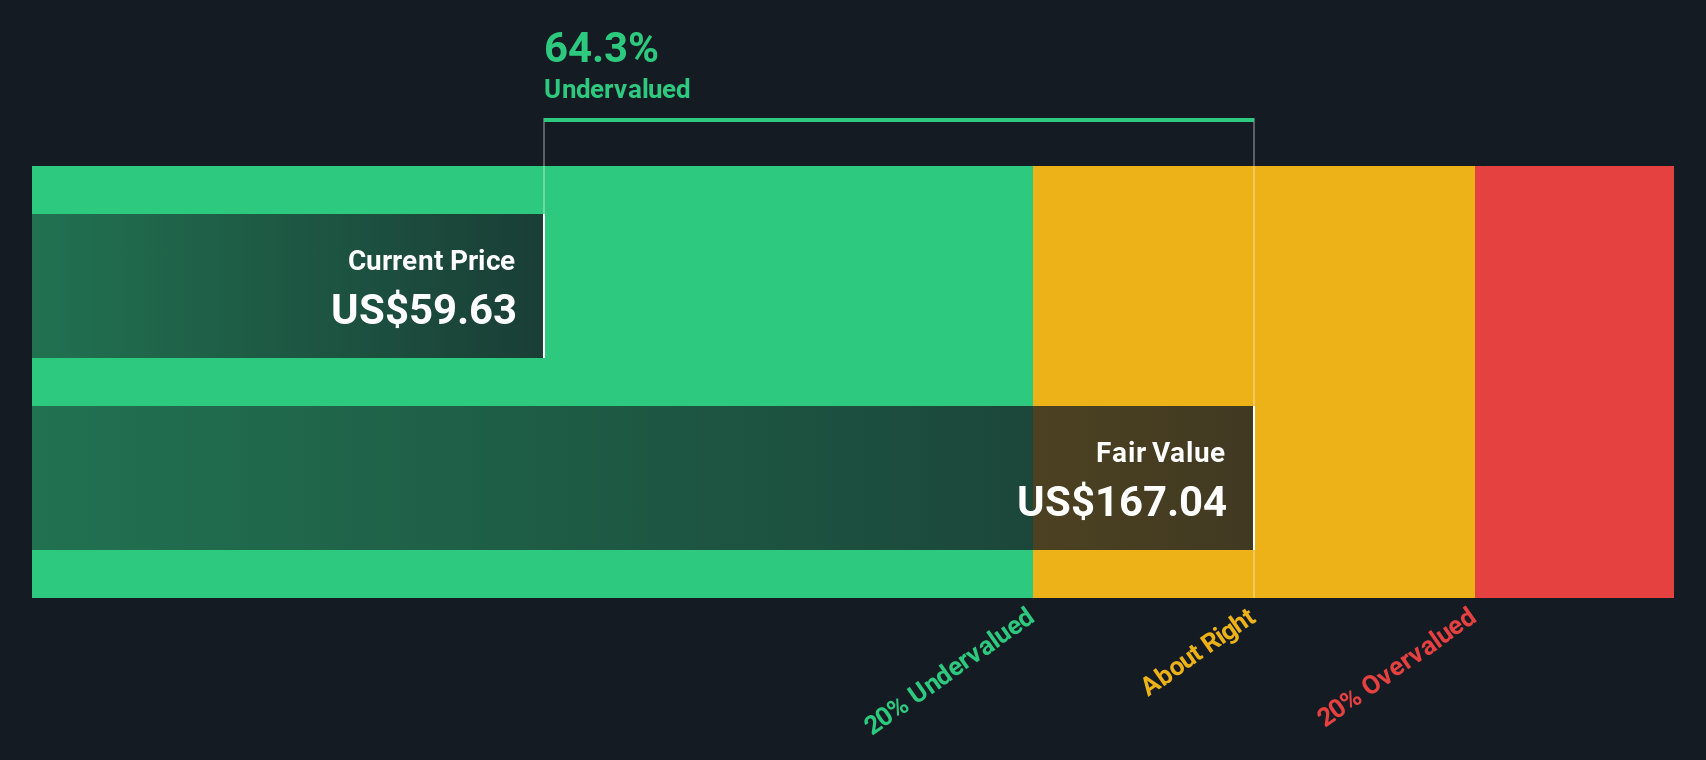
When all those future cash flows are discounted back, the model arrives at an intrinsic value of about $152.94 per share. With the DCF implying a 68.6% discount to the current market price, the shares screen as materially undervalued on this cash flow basis.
Result: UNDERVALUED
Our Discounted Cash Flow (DCF) analysis suggests Novo Nordisk is undervalued by 68.6%. Track this in your watchlist or portfolio, or discover 913 more undervalued stocks based on cash flows.
Approach 2: Novo Nordisk Price vs Earnings
For a profitable, mature business like Novo Nordisk, the price to earnings, or PE, ratio is a useful yardstick because it links what investors pay today to the profits the company is generating right now. In general, companies with stronger, more reliable growth and lower perceived risk can justify a higher PE, while slower growing or riskier businesses typically deserve a lower, or discounted, PE multiple.
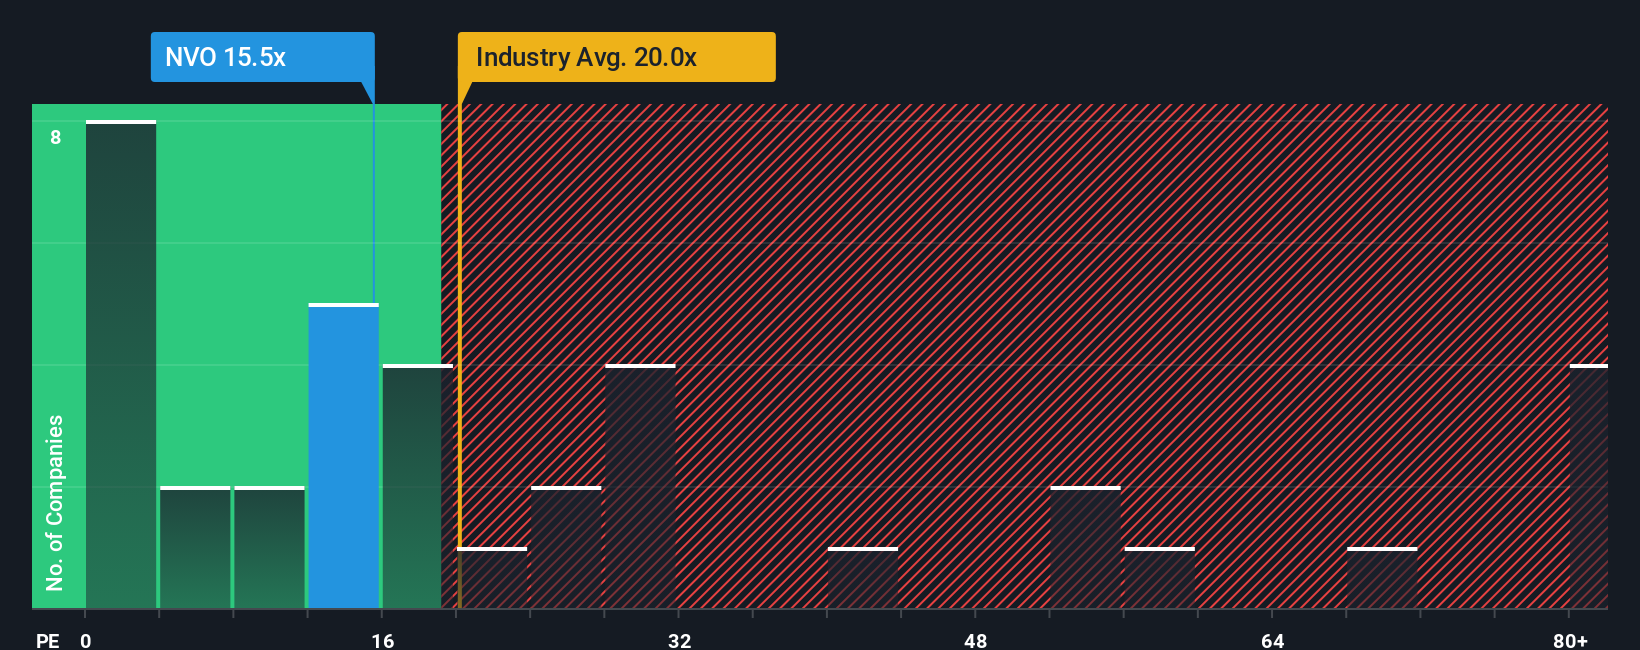
Today, Novo Nordisk trades on a PE of about 13.27x, which sits well below both the Pharmaceuticals industry average of roughly 19.79x and the peer group average of 16.47x. On the surface, that would suggest the market is pricing Novo Nordisk more conservatively than many of its competitors, despite its leading position in diabetes and obesity treatments.
Simply Wall St also uses a proprietary Fair Ratio to estimate what PE multiple a company should trade on, after considering its earnings growth outlook, profitability, risk profile, industry, and market cap. For Novo Nordisk, this Fair Ratio comes out at around 30.89x, which is materially higher than its current 13.27x. That gap implies the shares are trading at a significant discount to what might be expected given the company’s fundamentals.
Result: UNDERVALUED
PE ratios tell one story, but what if the real opportunity lies elsewhere? Discover 1463 companies where insiders are betting big on explosive growth.
Upgrade Your Decision Making: Choose your Novo Nordisk Narrative
Earlier we mentioned that there is an even better way to understand valuation, so let us introduce you to Narratives, a simple way to connect your view of Novo Nordisk’s story to the numbers you see on the screen. A Narrative is your own explanation for what you think will happen to a company’s revenue, earnings, and margins, and how that should translate into a fair value today. On Simply Wall St, Narratives live in the Community page and are used by millions of investors as an easy, accessible tool that links a company’s story to a financial forecast and then to a fair value you can compare against the current share price to decide whether to buy, hold, or sell. Narratives also update dynamically as new information like earnings or major news arrives, so your view never has to stay static. For Novo Nordisk, one investor’s Narrative might focus on policy risk and competition and arrive at a fair value near the bear case of around $70 per ADR, while another may emphasize long term GLP 1 demand and pipeline optionality and land closer to the bull case near $160.
Do you think there's more to the story for Novo Nordisk? Head over to our Community to see what others are saying!

This article by Simply Wall St is general in nature. We provide commentary based on historical data and analyst forecasts only using an unbiased methodology and our articles are not intended to be financial advice. It does not constitute a recommendation to buy or sell any stock, and does not take account of your objectives, or your financial situation. We aim to bring you long-term focused analysis driven by fundamental data. Note that our analysis may not factor in the latest price-sensitive company announcements or qualitative material. Simply Wall St has no position in any stocks mentioned.
Have feedback on this article? Concerned about the content? Get in touch with us directly. Alternatively, email editorial-team@simplywallst.com