
Can Iovance Biotherapeutics Recent Rebound Signal Long Term Value After 68.2% Slide in 2025
- Wondering if Iovance Biotherapeutics is a beaten down biotech bargain or a value trap? You are not alone, and this deep dive will help you decide whether the current price really makes sense.
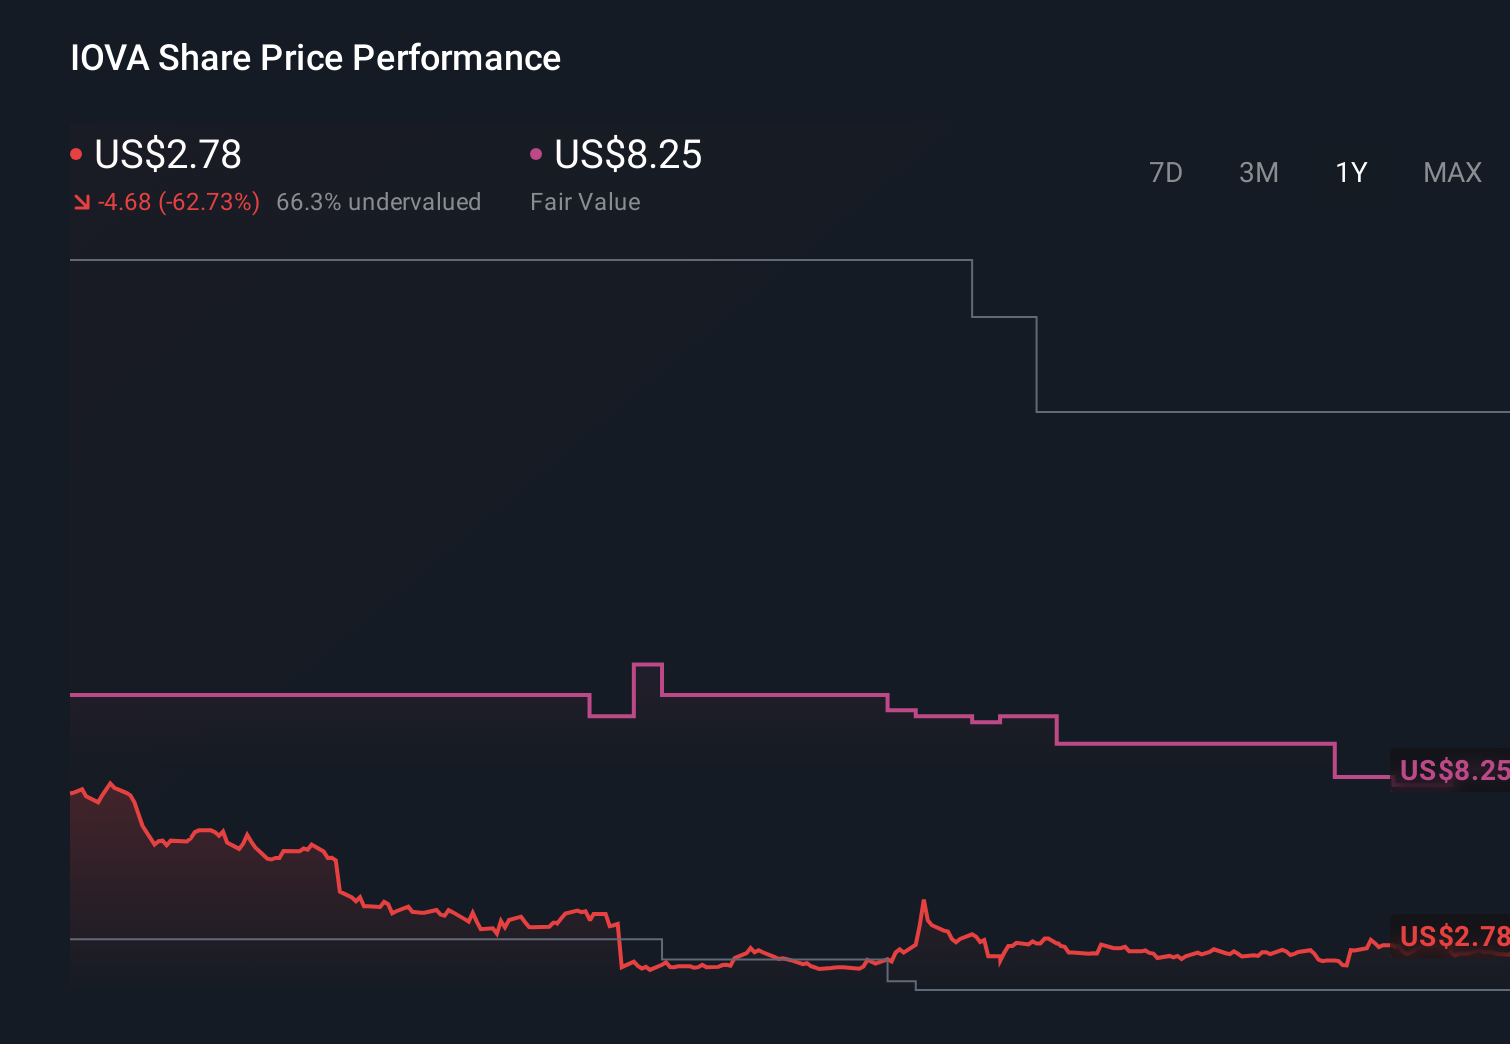
- The stock has bounced recently, up 12.7% over the last week and 10.7% over the past month, but that recovery still sits against a tough backdrop of a -68.2% year to date return and -95.0% over five years.
- Those moves have come as investors refocus on Iovance's pipeline progress and regulatory milestones, particularly around its tumor infiltrating lymphocyte therapies for hard to treat cancers. At the same time, shifting sentiment toward high risk biotech and ongoing capital needs have kept volatility elevated. This is crucial context for any valuation call.
- On our framework, Iovance scores a solid 5 out of 6 on undervaluation checks, suggesting the market may be underestimating its long term potential. Next, we will walk through the main valuation lenses investors use, before finishing with a more holistic way to think about what the stock is really worth.
Find out why Iovance Biotherapeutics's -66.4% return over the last year is lagging behind its peers.
Approach 1: Iovance Biotherapeutics Discounted Cash Flow (DCF) Analysis
A Discounted Cash Flow model estimates what a company is worth by projecting its future cash flows and then discounting them back into todays dollars. For Iovance Biotherapeutics, the 2 Stage Free Cash Flow to Equity model starts from a last twelve month free cash outflow of about $368 Million, reflecting heavy investment rather than profitability.
Analysts expect that to improve over time, with Simply Wall St using their forecasts for the next few years and then extrapolating further out. On this view, free cash flow could turn positive and reach roughly $658 Million by 2035, as the pipeline matures and operating leverage takes effect.
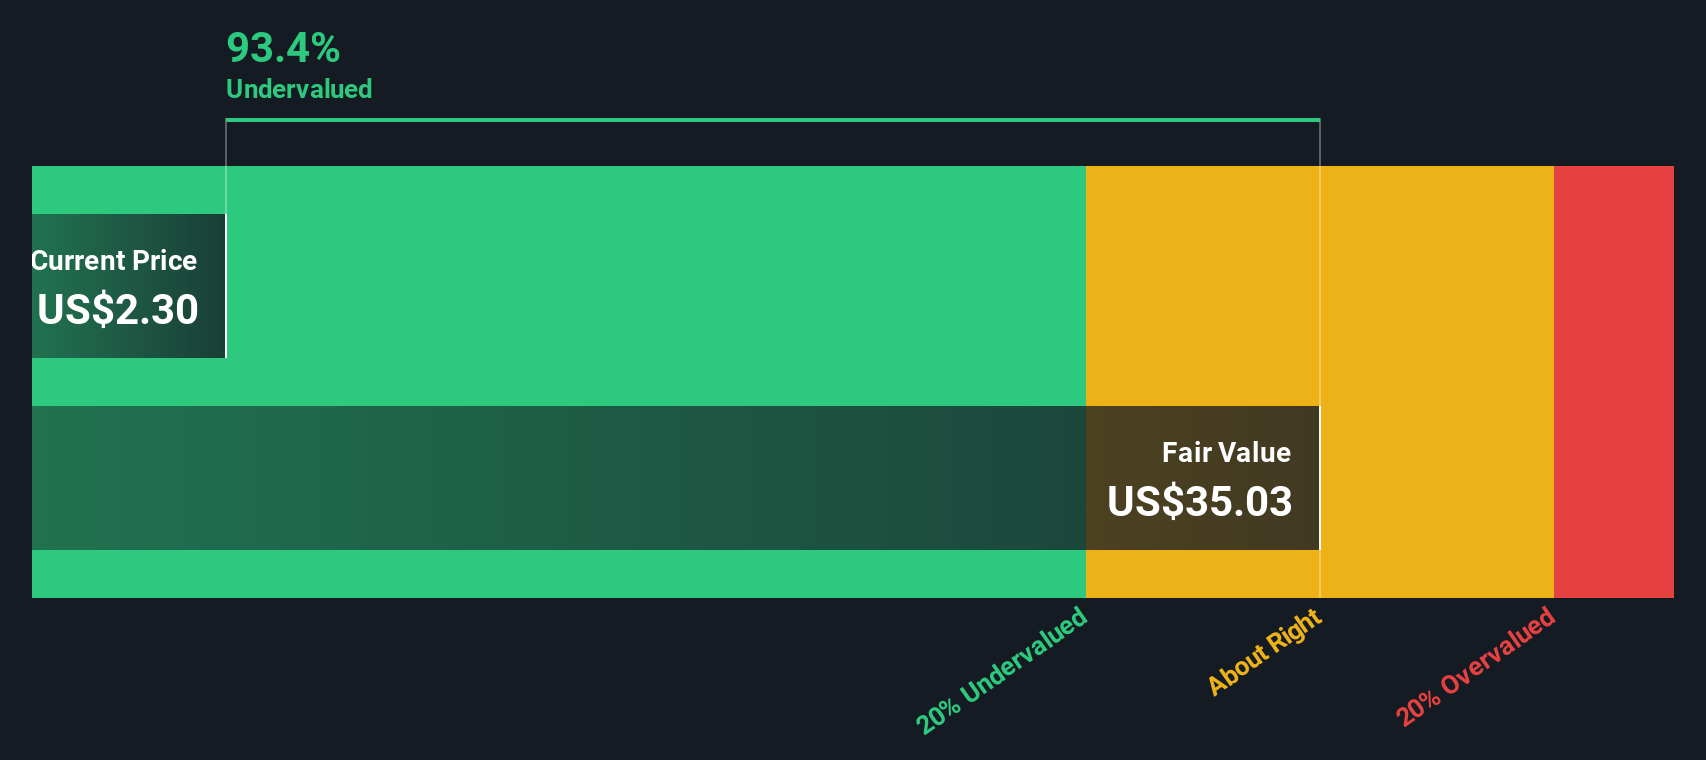
When all those future cash flows are discounted back to today and divided by the number of shares, the model produces an intrinsic value of about $28.06 per share in $. Compared with the current market price, this indicates the stock is roughly 91.2% undervalued, and that investors are heavily discounting Iovances long term cash generation potential.
Result: UNDERVALUED
Our Discounted Cash Flow (DCF) analysis suggests Iovance Biotherapeutics is undervalued by 91.2%. Track this in your watchlist or portfolio, or discover 913 more undervalued stocks based on cash flows.
Approach 2: Iovance Biotherapeutics Price vs Sales
For many profitable growth companies, the price to sales ratio is a handy shorthand for what investors are willing to pay for each dollar of revenue, especially in sectors where earnings are still ramping up or volatile. In general, higher growth and lower perceived risk justify a richer multiple, while slower growth or higher risk tend to cap what the market will tolerate.
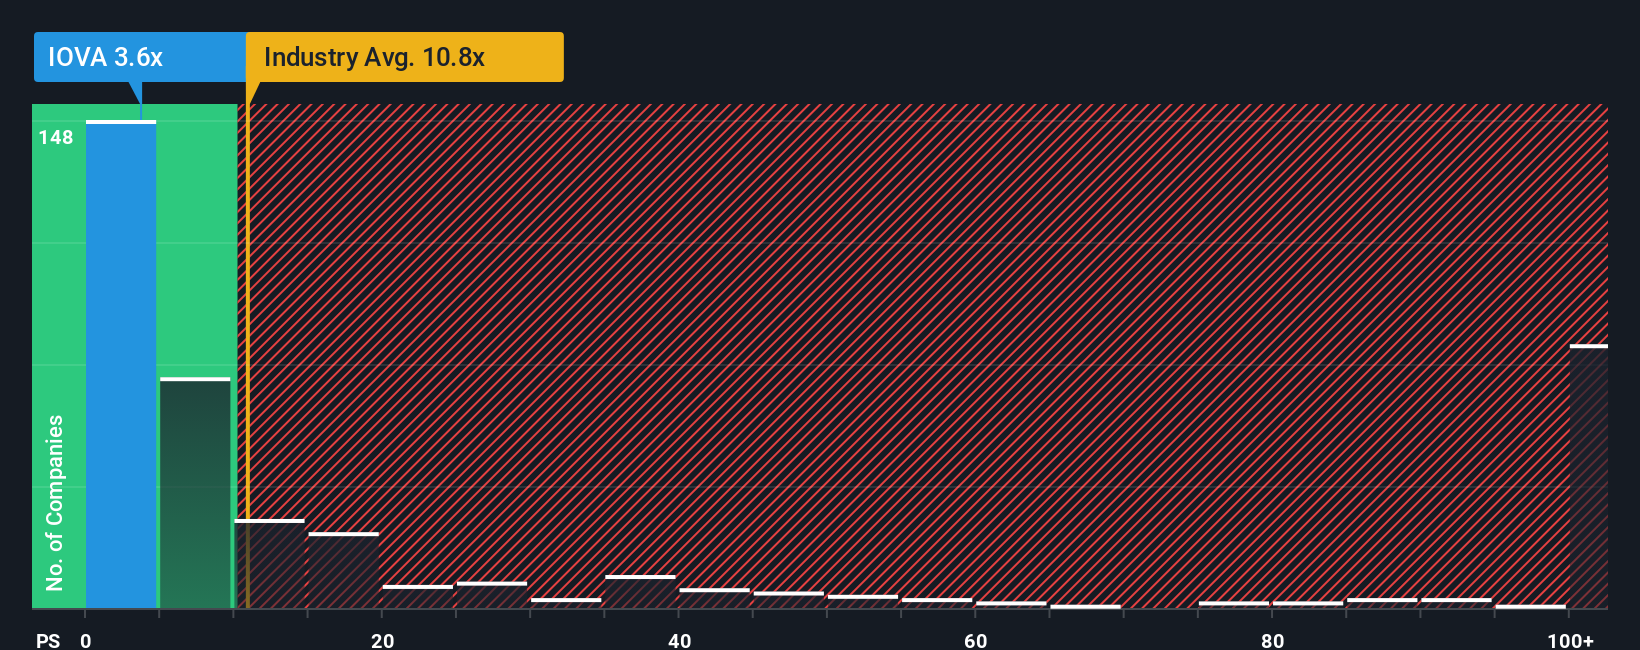
Iovance currently trades on a price to sales ratio of about 3.93x, which sits well below the broader Biotechs industry average of around 12.12x and under the peer group average near 6.81x. On the surface, that points to a discount, but simple comparisons can miss important nuances in growth, profitability and risk.
That is where Simply Wall St's Fair Ratio comes in. This proprietary measure estimates what a reasonable price to sales multiple should be, after factoring in Iovance's revenue growth profile, margins, risk, market cap and its specific biotech niche. For Iovance, the Fair Ratio is 4.58x, modestly above the current 3.93x. That gap suggests the stock is trading below what its fundamentals and risk profile might warrant on a sales basis.
Result: UNDERVALUED
PS ratios tell one story, but what if the real opportunity lies elsewhere? Discover 1464 companies where insiders are betting big on explosive growth.
Upgrade Your Decision Making: Choose your Iovance Biotherapeutics Narrative
Earlier we mentioned that there is an even better way to understand valuation, so let us introduce you to Narratives, a simple way to connect your view of the Iovance Biotherapeutics story with a financial forecast and a fair value estimate. On Simply Wall St's Community page, millions of investors build Narratives by laying out their expectations for future revenue, earnings and margins. The platform turns that story into a dynamic forecast and Fair Value that can be compared with the current share price to help guide investment decisions. Because Narratives automatically update when new information arrives, like fresh lung cancer trial data or changes to revenue guidance, they stay aligned with the evolving thesis instead of going stale in a spreadsheet. For example, one Iovance Narrative might assume global approvals, robust Amtagvi uptake and improving margins, supporting a Fair Value near the most bullish 20.0 dollars target. A more cautious Narrative could emphasize regulatory setbacks, pricing pressure and execution risk, landing closer to the most bearish 1.0 dollar view. Both can be tracked and refined over time.
Do you think there's more to the story for Iovance Biotherapeutics? Head over to our Community to see what others are saying!
This article by Simply Wall St is general in nature. We provide commentary based on historical data and analyst forecasts only using an unbiased methodology and our articles are not intended to be financial advice. It does not constitute a recommendation to buy or sell any stock, and does not take account of your objectives, or your financial situation. We aim to bring you long-term focused analysis driven by fundamental data. Note that our analysis may not factor in the latest price-sensitive company announcements or qualitative material. Simply Wall St has no position in any stocks mentioned.
Have feedback on this article? Concerned about the content? Get in touch with us directly. Alternatively, email editorial-team@simplywallst.com