
Is It Too Late to Consider Powell Industries After Its 860% Multi Year Surge?
- If you are wondering whether Powell Industries is still a smart buy after its massive run or if most of the easy gains are already behind it, this article will help you size up the stock from a valuation perspective.
- After an extraordinary multiyear climb of about 860.5% over three years and 1108.8% over five years, the stock is still up 45.5% year to date and 36.1% over the past year, even though it has dipped about 1.2% in the last week while gaining 18.0% over the past month.
- Recent moves have been driven by growing investor enthusiasm around grid modernization, electrification projects, and long duration infrastructure spending that may sustain demand for Powell Industries switchgear and related power equipment. Broader market attention on companies leveraged to energy transition and critical infrastructure has also contributed to a rerating of the stock, as investors reassess long term growth and risk.
- Right now, Powell Industries scores a 2 out of 6 on our valuation checks. This suggests some parts of the market may be getting ahead of themselves while others still see upside. In this article, we will walk through the main valuation methods investors use, then finish by exploring a more insightful way to connect valuation with the company’s long term narrative.
Powell Industries scores just 2/6 on our valuation checks. See what other red flags we found in the full valuation breakdown.
Approach 1: Powell Industries Discounted Cash Flow (DCF) Analysis
A Discounted Cash Flow, or DCF, estimates what a company is worth today by projecting the cash it could generate in the future and discounting those cash flows back to their value in today’s dollars.
For Powell Industries, the model starts with last twelve month free cash flow of about $155.0 Million, then uses analyst forecasts and extrapolations to map out how this could evolve. Simply Wall St applies a 2 stage Free Cash Flow to Equity model, with explicit projections through 2030 and then slowing growth, reaching a forecast free cash flow of roughly $149 Million in 2030, with further estimated increases beyond that.
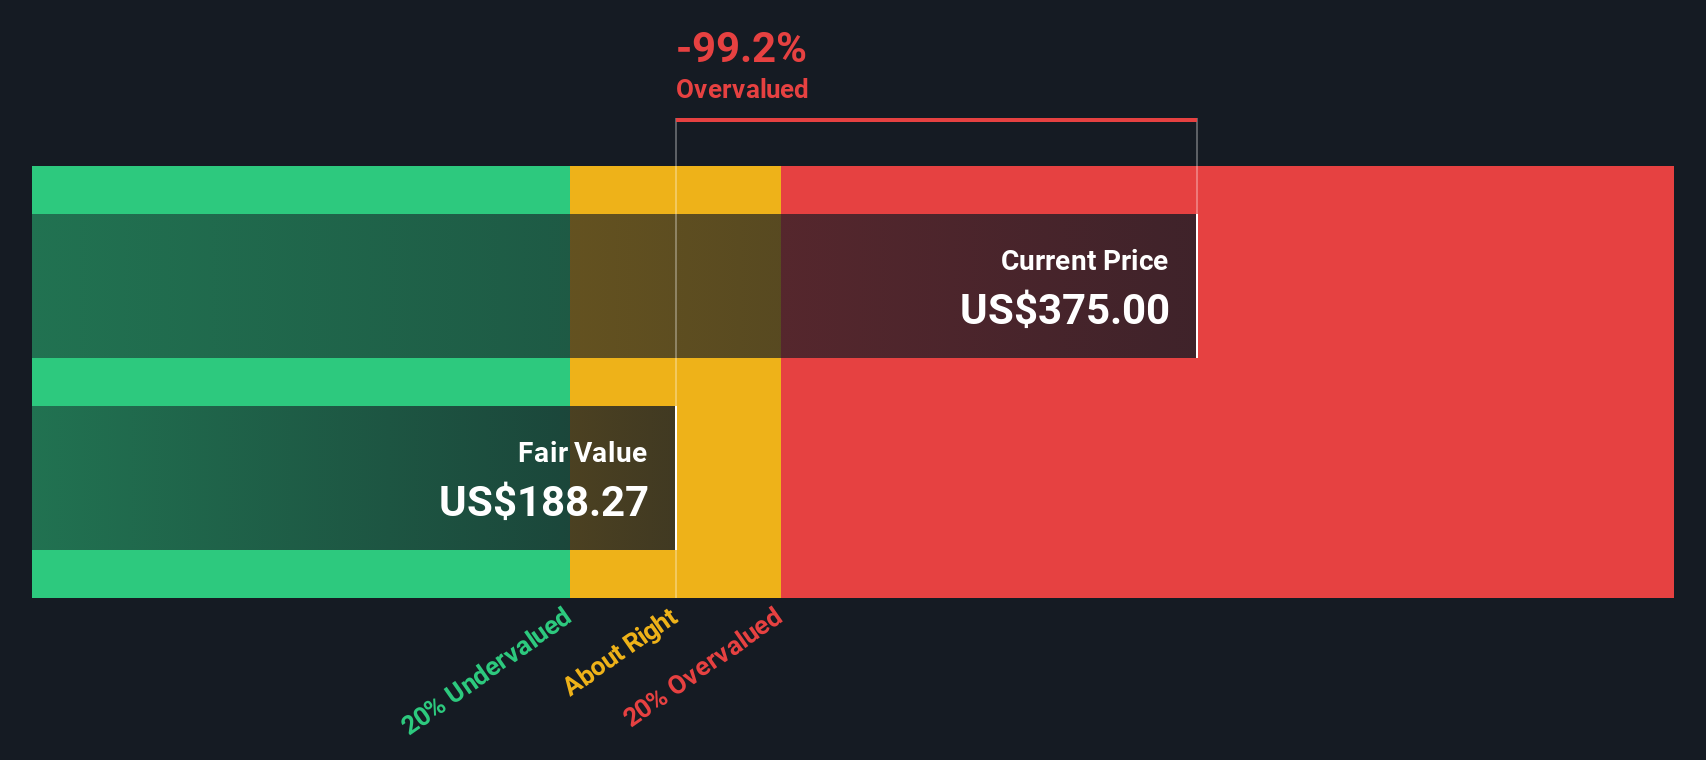
When all of these future cash flows are discounted back, the DCF model produces an estimated intrinsic value of around $206.33 per share. Based on current market pricing, this implies the stock is about 61.3% above its DCF based fair value. This suggests investors are paying a substantial premium for Powell Industries future growth story.
Result: OVERVALUED
Our Discounted Cash Flow (DCF) analysis suggests Powell Industries may be overvalued by 61.3%. Discover 913 undervalued stocks or create your own screener to find better value opportunities.
Approach 2: Powell Industries Price vs Earnings
For profitable businesses like Powell Industries, the price to earnings, or PE, ratio is often the clearest quick check on valuation because it directly links what investors pay today to the profits the company is generating.
What counts as a fair PE depends on how fast earnings are expected to grow and how risky that growth looks. Higher growth and lower perceived risk can justify a higher multiple, while slower or more uncertain growth usually deserves a discount.
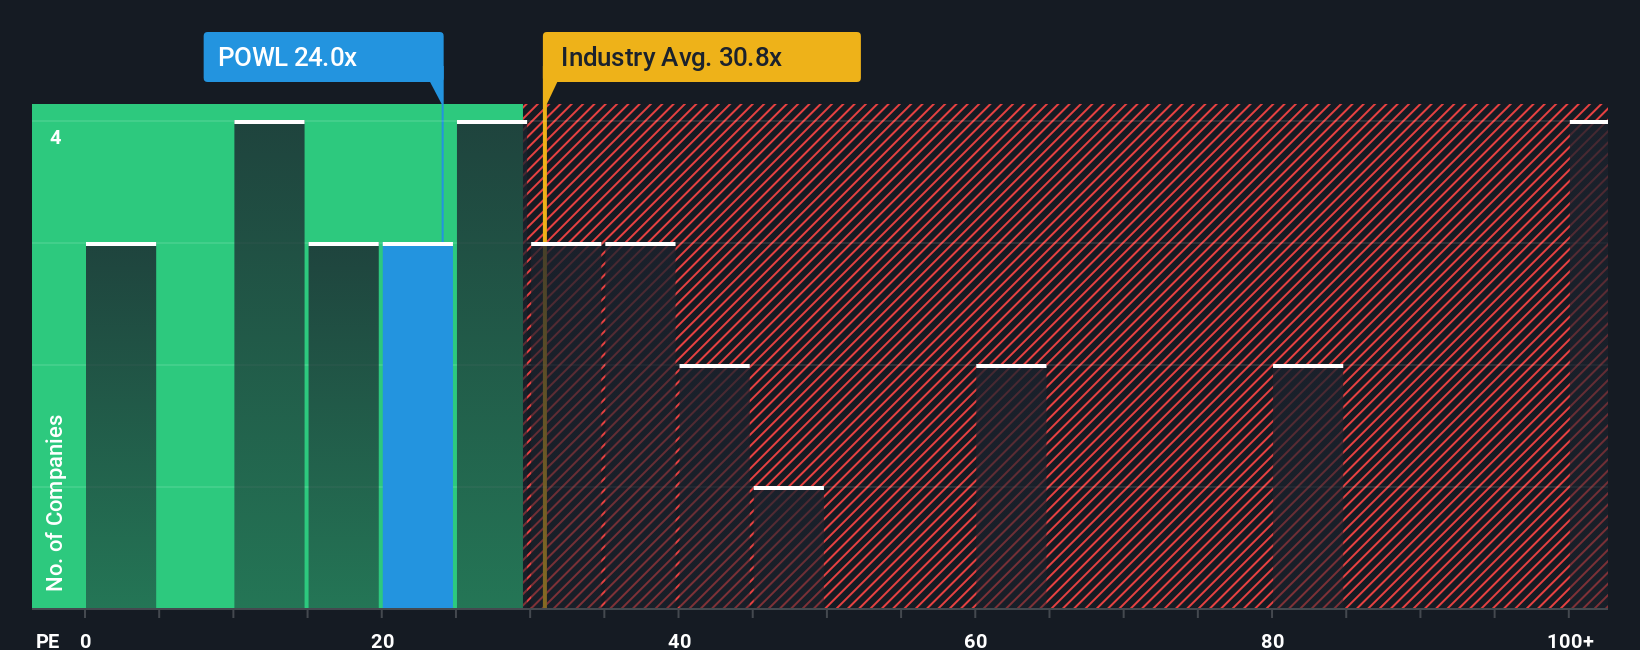
Powell Industries currently trades at about 22.27x earnings, which is below both the broader Electrical industry average of roughly 31.44x and a peer group average near 46.76x. Simply Wall St also calculates a Fair Ratio of around 20.99x. This is a proprietary estimate of what a reasonable PE should be given Powell Industries earnings growth profile, margins, industry positioning, market cap, and risk factors.
This Fair Ratio is more tailored than a simple industry or peer comparison because it adjusts for company specific strengths and vulnerabilities rather than assuming all Electrical stocks deserve the same multiple. With Powell Industries trading just slightly above its Fair Ratio, the stock appears modestly expensive rather than dramatically mispriced.
Result: OVERVALUED
PE ratios tell one story, but what if the real opportunity lies elsewhere? Discover 1464 companies where insiders are betting big on explosive growth.
Upgrade Your Decision Making: Choose your Powell Industries Narrative
Earlier we mentioned that there is an even better way to understand valuation, so let us introduce Narratives, a simple way to connect your view of Powell Industries business to a concrete forecast and fair value by telling the story behind your numbers for future revenue, earnings, and margins. On Simply Wall St’s Community page, used by millions of investors, Narratives make this process easy and accessible by guiding you to outline what you think will happen to Powell Industries orders, margins, and competitive position, then automatically linking that story to a set of financial projections and a resulting fair value that you can compare to the current share price to decide whether to buy, hold, or sell. Because Narratives update dynamically as new information, such as earnings results or expansion news, comes in, your fair value view evolves with the facts rather than staying static. For Powell Industries, one investor might build an optimistic Narrative around continued grid modernization, margin resilience, and a fair value above the current analyst high of about $280 per share, while another might emphasize margin normalization, rising competition, and a fair value closer to the low end near $225, and Narratives make both perspectives explicit and comparable.
Do you think there's more to the story for Powell Industries? Head over to our Community to see what others are saying!

This article by Simply Wall St is general in nature. We provide commentary based on historical data and analyst forecasts only using an unbiased methodology and our articles are not intended to be financial advice. It does not constitute a recommendation to buy or sell any stock, and does not take account of your objectives, or your financial situation. We aim to bring you long-term focused analysis driven by fundamental data. Note that our analysis may not factor in the latest price-sensitive company announcements or qualitative material. Simply Wall St has no position in any stocks mentioned.
Have feedback on this article? Concerned about the content? Get in touch with us directly. Alternatively, email editorial-team@simplywallst.com