
Can Amphastar’s Recent Rebound Signal a Compelling Opportunity in 2025?
- Wondering if Amphastar Pharmaceuticals at around $26.60 is a hidden bargain or a value trap? This breakdown will help you decide whether it still deserves a spot on your watchlist.
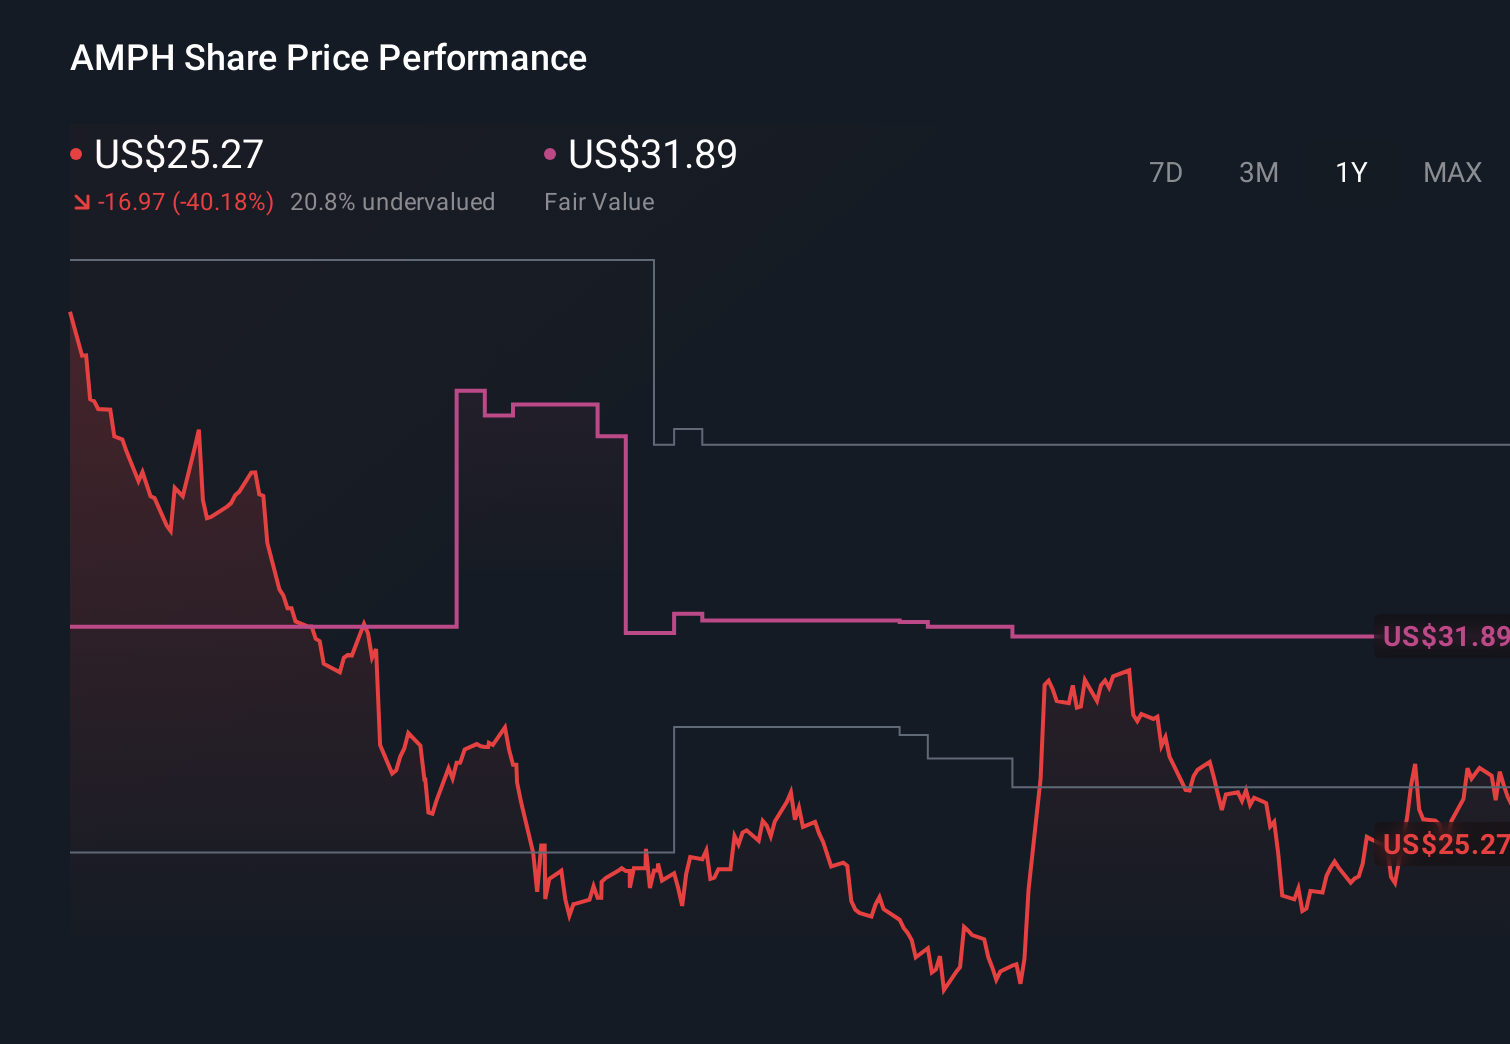
- The stock has bounced 5.3% over the last week and 2.3% over the past month, even though it is still down 26.8% year to date and 32.0% over the last year.
- Investors have been reacting to a mix of pipeline updates, regulatory developments, and shifting sentiment across the broader generics and specialty pharma space, which all feed into Amphastar's risk reward profile. At the same time, sector wide chatter around drug pricing reform and competition in key injectable products has kept volatility elevated.
- Despite that backdrop, Amphastar currently scores a solid 5/6 on our valuation checks, suggesting it screens as undervalued on most measures. We will walk through those methods next, then circle back to an even more intuitive way to think about what the stock is really worth.
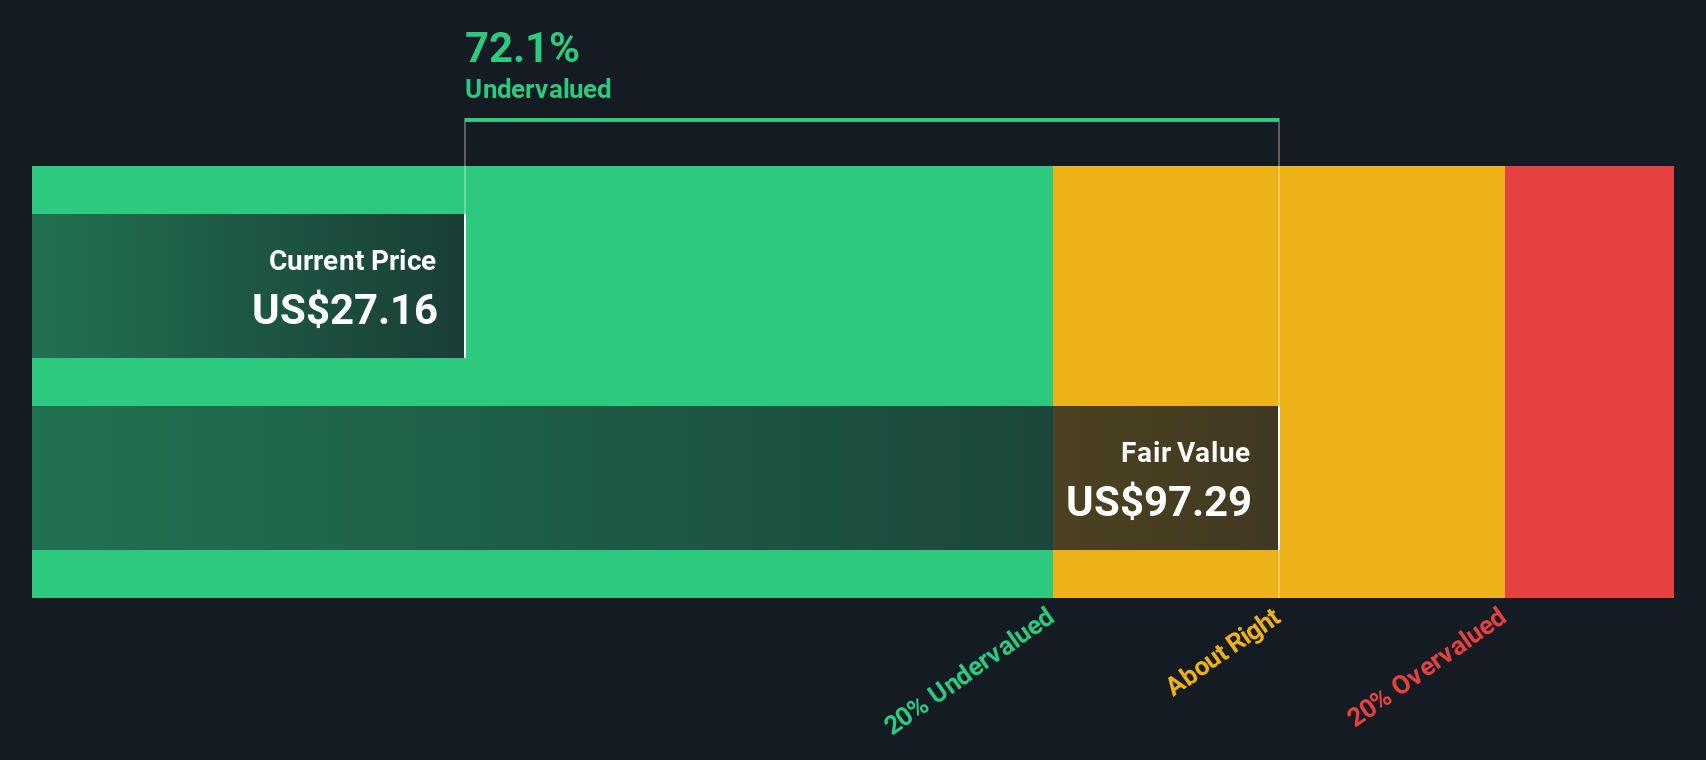
Approach 1: Amphastar Pharmaceuticals Discounted Cash Flow (DCF) Analysis
A Discounted Cash Flow, or DCF, model estimates what a company is worth by projecting the cash it can generate in the future and discounting those cash flows back to today in dollar terms.
For Amphastar Pharmaceuticals, the 2 Stage Free Cash Flow to Equity model starts with last twelve month Free Cash Flow of about $110.7 million. It then grows this using a mix of analyst estimates and Simply Wall St extrapolations. Analyst projections and subsequent estimates see annual Free Cash Flow rising toward roughly $218.8 million by 2035, reflecting solid, but moderating, growth over time.
When these projected cash flows are discounted back to today, the model produces an intrinsic value of about $97.29 per share. Versus the current share price near $26.60, the DCF implies the stock is around 72.7% undervalued, suggesting a meaningful margin of safety if these cash flow assumptions prove accurate.
Result: UNDERVALUED
Our Discounted Cash Flow (DCF) analysis suggests Amphastar Pharmaceuticals is undervalued by 72.7%. Track this in your watchlist or portfolio, or discover 914 more undervalued stocks based on cash flows.
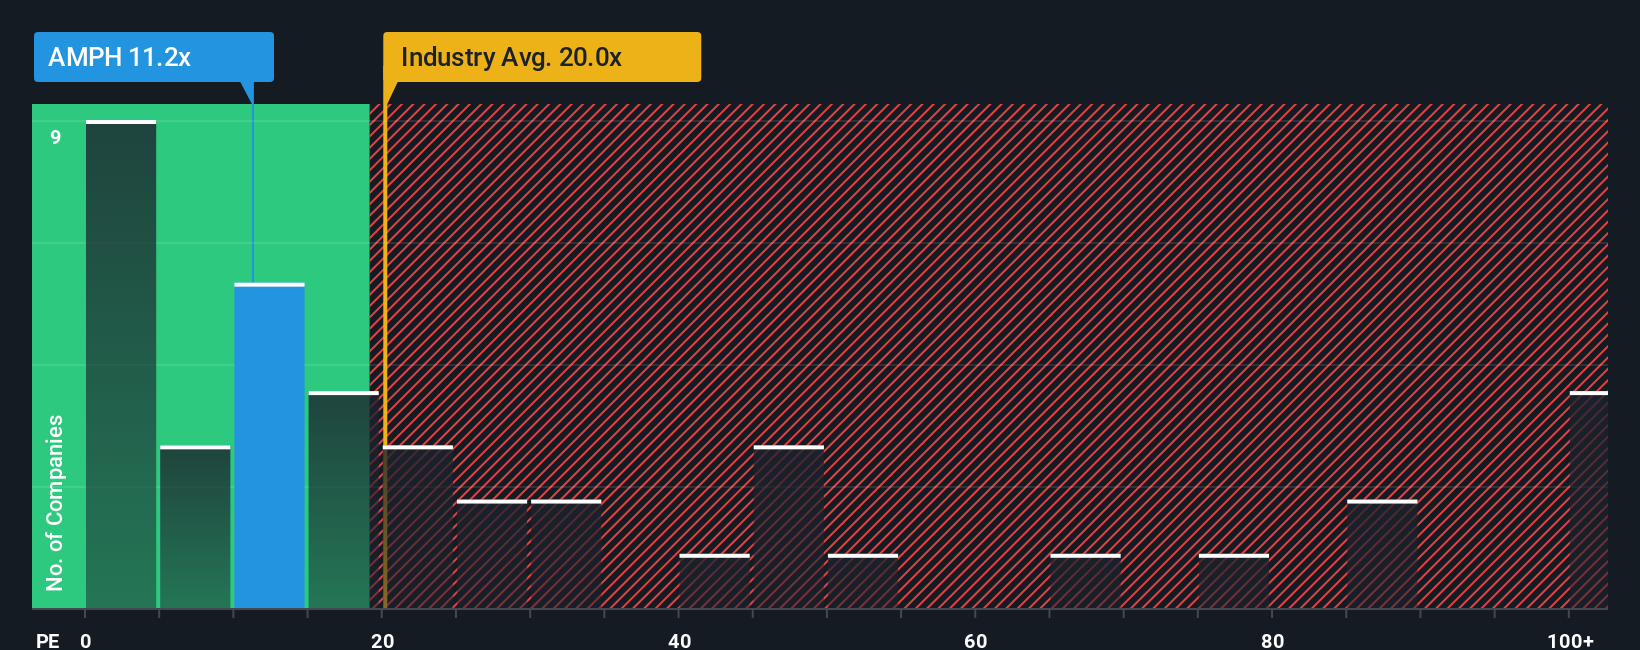
Approach 2: Amphastar Pharmaceuticals Price vs Earnings
For profitable companies like Amphastar, the price to earnings (PE) ratio is a useful yardstick because it links what investors are paying for the stock to the profits the business is already generating. In general, companies with faster, more reliable earnings growth and lower perceived risk can justify a higher PE ratio, while slower growing or riskier names usually deserve a lower multiple.
Amphastar currently trades on a PE of about 10.9x, which is well below both the broader Pharmaceuticals industry average near 19.8x and the peer group average around 33.5x. That discount looks sizeable at first glance, but it does not tell the full story about the company’s specific growth profile and risk factors.
Simply Wall St’s Fair Ratio framework aims to fill that gap by estimating what PE you would reasonably expect for Amphastar given its earnings growth outlook, profitability, industry positioning, market cap and risk profile. For Amphastar, this Fair Ratio sits at roughly 16.0x, suggesting investors are paying materially less than what would normally be implied by those fundamentals, which points to the shares looking undervalued on this approach.
Result: UNDERVALUED
PE ratios tell one story, but what if the real opportunity lies elsewhere? Discover 1463 companies where insiders are betting big on explosive growth.
Upgrade Your Decision Making: Choose your Amphastar Pharmaceuticals Narrative
Earlier we mentioned that there is an even better way to understand valuation, so let us introduce you to Narratives, a simple way to turn your view of Amphastar into a story that connects your assumptions about future revenue, earnings, and margins to a clear fair value estimate.
A Narrative is your investment storyline for a company, where you spell out what you think will happen to its business, translate that into a financial forecast, and then see what price those assumptions imply the stock should be worth.
On Simply Wall St’s Community page, Narratives are an easy, guided tool used by millions of investors to compare their Fair Value to the current market Price and decide how that aligns with their own approach. These Narratives automatically update when fresh information, such as earnings or major news, is released.
For Amphastar, one investor might build a cautious Narrative that leans on the lower 25 dollar analyst target because they expect intensifying competition to pressure margins. Another investor might construct a more optimistic Narrative closer to 38 dollars if they believe the pipeline, domestic manufacturing expansion, and rising demand for affordable injectables will drive stronger growth and profitability than the market currently prices in.
Do you think there's more to the story for Amphastar Pharmaceuticals? Head over to our Community to see what others are saying!
This article by Simply Wall St is general in nature. We provide commentary based on historical data and analyst forecasts only using an unbiased methodology and our articles are not intended to be financial advice. It does not constitute a recommendation to buy or sell any stock, and does not take account of your objectives, or your financial situation. We aim to bring you long-term focused analysis driven by fundamental data. Note that our analysis may not factor in the latest price-sensitive company announcements or qualitative material. Simply Wall St has no position in any stocks mentioned.
Have feedback on this article? Concerned about the content? Get in touch with us directly. Alternatively, email editorial-team@simplywallst.com