
Best Buy (BBY): Reassessing Valuation After Recent Share Price Pullback and Profit Growth
Best Buy (BBY) has drifted lower over the past month, even as its latest annual numbers showed modest revenue growth and a near 19% jump in net income, raising some interesting questions about valuation.
See our latest analysis for Best Buy.
At around $71.83, the 1 year to date share price return of negative 16.64 percent and 1 year total shareholder return of negative 11.52 percent suggest momentum has cooled lately. However, the 3 year total shareholder return of 1.97 percent hints that longer term holders have at least broken even overall.
If Best Buy’s recent pullback has you reassessing retail tech exposure, it could be a good moment to scan fast growing stocks with high insider ownership for other potential ideas.
With profit growth outpacing sales and the stock trading at a discount to analyst targets and some intrinsic value estimates, investors face a familiar dilemma: is Best Buy quietly undervalued, or is the market already pricing in its future recovery?
Most Popular Narrative Narrative: 14.4% Undervalued
With Best Buy last closing at $71.83 against a most popular narrative fair value near $83.90, the story leans toward a recovery that is not fully reflected in the price.
Several research teams expect alternative profit streams, including retail media and other high margin initiatives, to drive structural gross margin expansion and push EPS above $7 by 2026, supporting upside to intrinsic value.
Curious how relatively modest revenue growth can still back a much higher earnings base and richer margins than today? The narrative leans on a detailed roadmap of expanding services, marketplace economics, and leaner cost structures that together support a meaningfully higher profit run rate than the current share price implies.
Result: Fair Value of $83.90 (UNDERVALUED)
Have a read of the narrative in full and understand what's behind the forecasts.
However, rising e commerce competition and a sales mix tilting toward lower margin categories could pressure profitability and undermine the margin expansion narrative.
Find out about the key risks to this Best Buy narrative.
Another Angle on Valuation
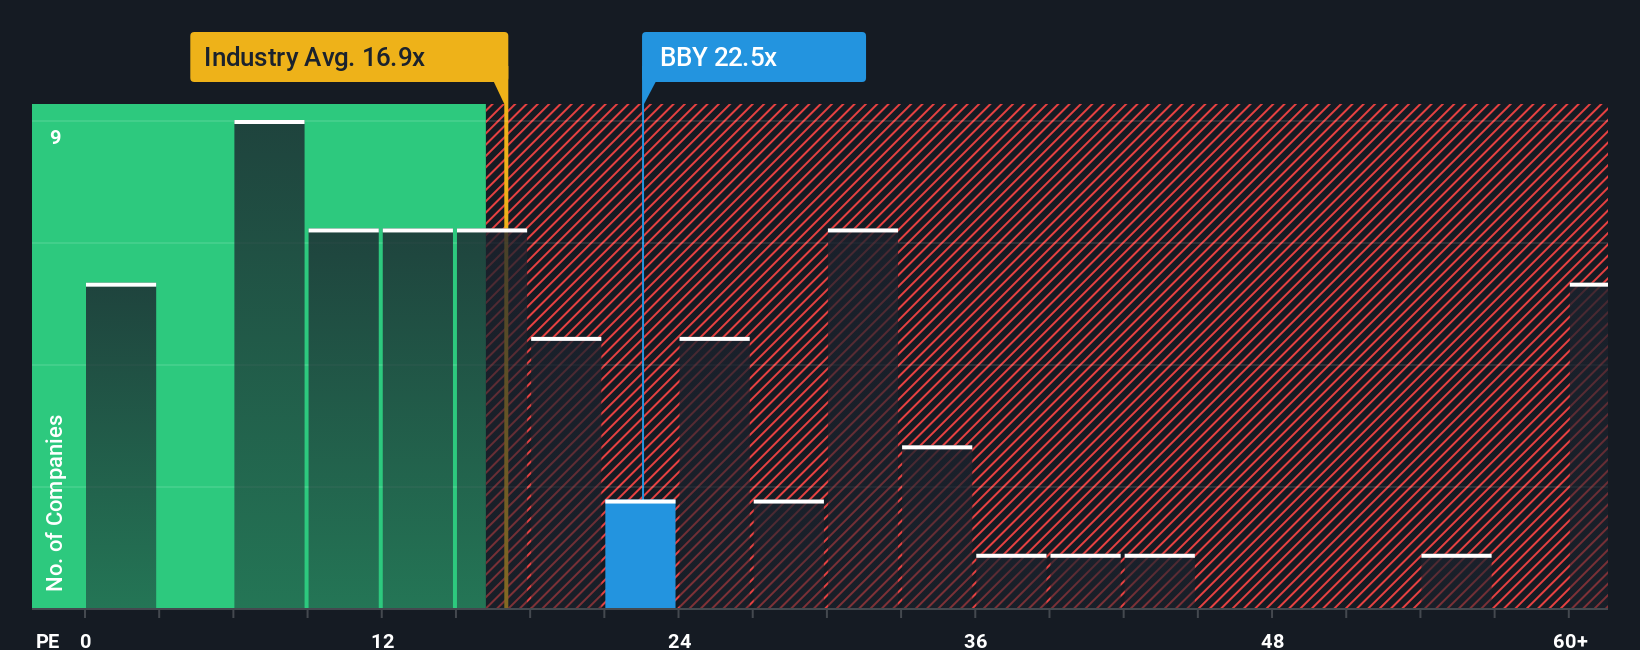
On simple earnings metrics, Best Buy looks less clear cut. The stock trades at about 23.3 times earnings versus a US specialty retail average near 20.3 times, and only slightly above a fair ratio of 23.1 times. This hints that any mispricing may be narrow rather than obvious.
See what the numbers say about this price — find out in our valuation breakdown.
Build Your Own Best Buy Narrative
If you see the story differently, or prefer digging into the numbers yourself, you can build a personalized narrative in just a few minutes: Do it your way.
A great starting point for your Best Buy research is our analysis highlighting 2 key rewards and 3 important warning signs that could impact your investment decision.
Ready for more high conviction ideas?
Before you move on, lock in your next moves with data backed stock ideas from our screeners so you are not guessing where opportunities might be hiding.
- Lock in potential bargains early by reviewing these 914 undervalued stocks based on cash flows that the market may be mispricing relative to their future cash flows.
- Tap into powerful long term themes by scanning these 24 AI penny stocks shaping how software, automation, and intelligent systems transform entire industries.
- Strengthen your portfolio income by targeting these 12 dividend stocks with yields > 3% that can support returns even when markets turn choppy.
This article by Simply Wall St is general in nature. We provide commentary based on historical data and analyst forecasts only using an unbiased methodology and our articles are not intended to be financial advice. It does not constitute a recommendation to buy or sell any stock, and does not take account of your objectives, or your financial situation. We aim to bring you long-term focused analysis driven by fundamental data. Note that our analysis may not factor in the latest price-sensitive company announcements or qualitative material. Simply Wall St has no position in any stocks mentioned.
Have feedback on this article? Concerned about the content? Get in touch with us directly. Alternatively, email editorial-team@simplywallst.com