
Is It Too Late To Consider Theon International After Its 2024 Defense Contract Gains?
- Wondering if Theon International is still worth a look after its big run, or if the easy money has already been made? This article will walk through what the current share price is really baking in.
- The stock has been choppy in the short term, down 6.0% over the last week but still up 3.4% over 30 days and 107.6% year to date and 133.2% over the past year. That naturally raises questions about how much upside is left versus the risk of a pullback.
- Recent headlines have focused on Theon International winning new defense and security contracts and expanding its presence in key European markets, which helps explain why investors have been willing to pay up for the stock. At the same time, commentary around rising geopolitical tensions and increased defense spending has reinforced the idea that its growth story could be more than just a short term bump.
- Despite all that excitement, Theon International only earns a 3/6 valuation score, suggesting the market may already be pricing in a fair chunk of its prospects. Next, we will break down what different valuation approaches say about the shares and finish by looking at a way to judge whether the current price really makes sense.
Approach 1: Theon International Discounted Cash Flow (DCF) Analysis
A Discounted Cash Flow (DCF) model estimates what a company is worth today by projecting the cash it can generate in the future and then discounting those cash flows back to their value in the present.
For Theon International, the model starts with last twelve month free cash flow of about €32.9 million and then applies a 2 Stage Free Cash Flow to Equity framework. Analyst estimates drive the near term, with free cash flow expected to reach roughly €101 million by 2028. Simply Wall St then extrapolates this trajectory out over a full decade using gradually slowing growth assumptions.
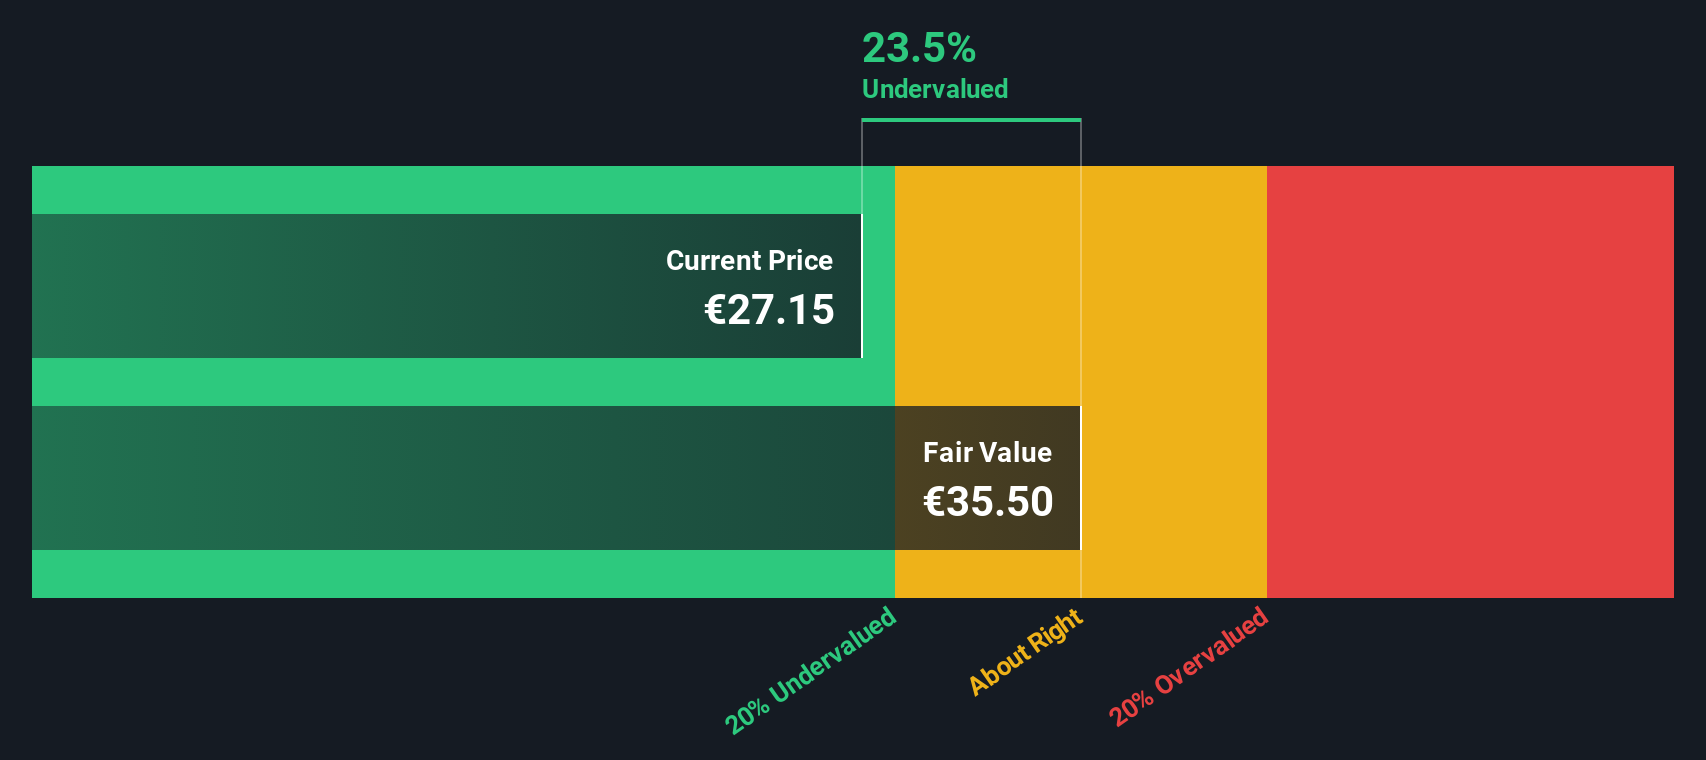
Adding up all those discounted cash flows produces an estimated intrinsic value of around €30.87 per share. Compared with the current market price, this implies the stock trades at roughly an 11.2% discount, suggesting investors are not yet fully paying for the projected cash generation, even after the recent share price surge.
Result: UNDERVALUED
Our Discounted Cash Flow (DCF) analysis suggests Theon International is undervalued by 11.2%. Track this in your watchlist or portfolio, or discover 914 more undervalued stocks based on cash flows.
Approach 2: Theon International Price vs Earnings (PE)
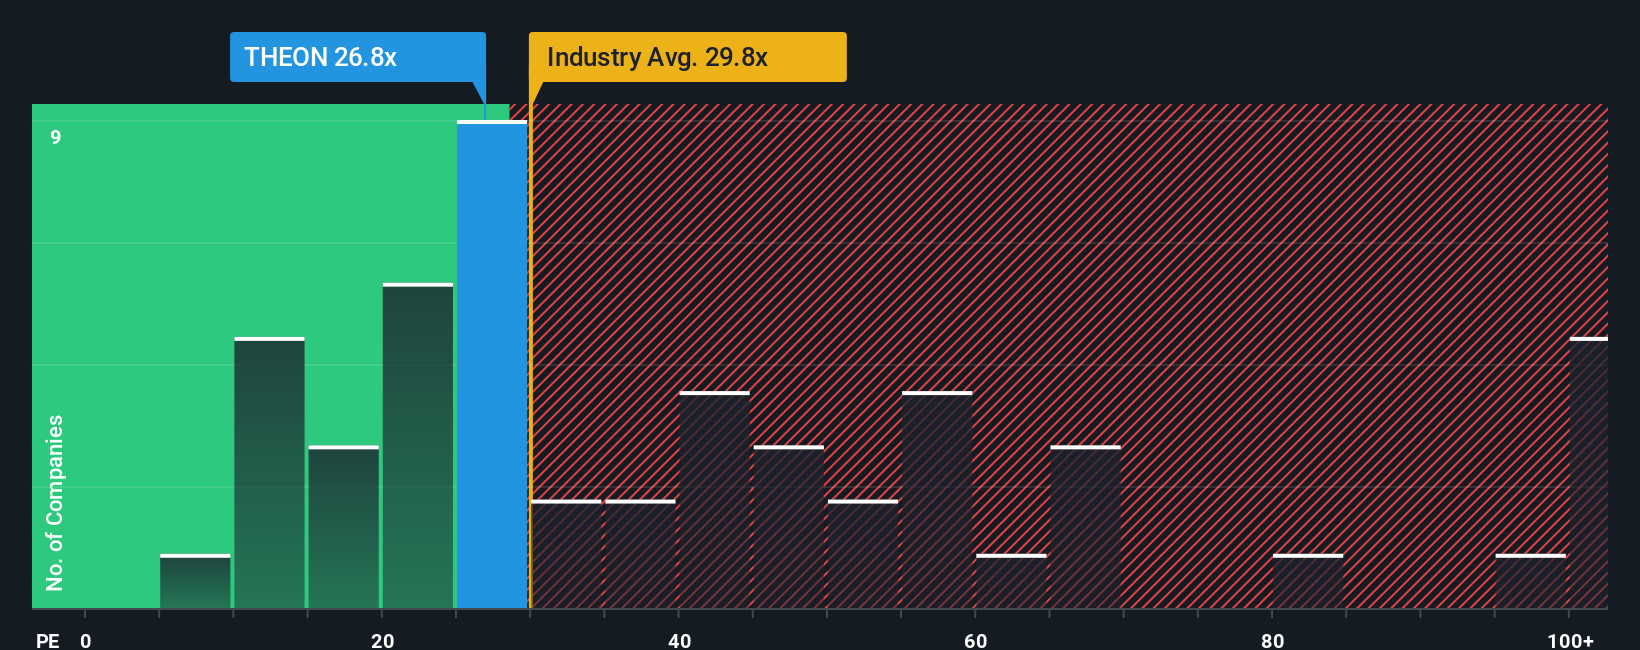
For a profitable business like Theon International, the price to earnings (PE) ratio is a useful way to gauge how much investors are willing to pay for each euro of current earnings. In general, faster growing and lower risk companies can justify a higher PE, while slower growth or higher uncertainty usually deserve a lower multiple.
Theon International currently trades on a PE of about 26.3x. That is well below the broader Aerospace and Defense industry average of roughly 47.5x, but above the 17.3x average of closer peers. This suggests investors see it as higher quality or higher growth than many direct comparables. Simply Wall St also calculates a Fair Ratio of 23.8x, a proprietary estimate of what a balanced PE should be once you factor in the company’s earnings growth outlook, profitability, risk profile, industry and market cap.
Because the Fair Ratio adjusts for these fundamentals, it offers a more tailored benchmark than a simple comparison with peers or the industry, which can be distorted by very mature or very speculative names. With Theon International trading moderately above its Fair Ratio, the shares look slightly expensive on earnings, but not wildly so.
Result: OVERVALUED
PE ratios tell one story, but what if the real opportunity lies elsewhere? Discover 1462 companies where insiders are betting big on explosive growth.
Upgrade Your Decision Making: Choose your Theon International Narrative
Earlier we mentioned that there is an even better way to understand valuation, so let us introduce you to Narratives, a simple framework that lets you attach a clear story to the numbers behind Theon International, such as what you think its fair value should be and how fast revenue, earnings and margins might grow. A Narrative links three things together: the company’s story, a financial forecast and a resulting fair value, so you can see exactly how your view of the business translates into a price you are willing to pay. Narratives are built into Simply Wall St’s Community page, where millions of investors can create or follow these story driven valuations without needing to build their own models from scratch. By comparing each Narrative’s Fair Value to the current share price, you can quickly decide whether Theon International looks like a buy, hold or sell, and those Narratives update dynamically as fresh news or earnings are released. For example, one investor might build a very optimistic Narrative with rapid contract wins and high margins, while another assumes slower growth and more modest profitability, leading to very different fair values for the same stock.
Do you think there's more to the story for Theon International? Head over to our Community to see what others are saying!

This article by Simply Wall St is general in nature. We provide commentary based on historical data and analyst forecasts only using an unbiased methodology and our articles are not intended to be financial advice. It does not constitute a recommendation to buy or sell any stock, and does not take account of your objectives, or your financial situation. We aim to bring you long-term focused analysis driven by fundamental data. Note that our analysis may not factor in the latest price-sensitive company announcements or qualitative material. Simply Wall St has no position in any stocks mentioned.
Have feedback on this article? Concerned about the content? Get in touch with us directly. Alternatively, email editorial-team@simplywallst.com