
TKC Corporation (TSE:9746): Valuation Check After New Multi‑Year Buyback and Dividend Strategy
TKC (TSE:9746) has outlined a clear five-year shareholder return roadmap, committing to sizable buybacks and targeting a roughly 50% dividend payout ratio, which is drawing attention from investors.
See our latest analysis for TKC.
That clarity on capital returns seems to be resonating with the market, with a solid year to date share price return of 12.8% and a three year total shareholder return of 29.1% suggesting momentum is gradually building rather than fading.
If this kind of disciplined capital allocation appeals to you, it could be a good moment to broaden your watchlist and discover fast growing stocks with high insider ownership.
Yet with TKC trading at a meaningful discount to analyst targets despite solid earnings growth and a richer payout, investors now face a key question: is this a genuine opportunity, or is the market already pricing in future growth?
Price-to-Earnings of 17.7x: Is it justified?
On a price-to-earnings ratio of 17.7x at a last close of ¥4,180, TKC looks slightly pricey versus its sector but cheaper than close peers.
The price to earnings multiple compares the company’s share price to its per share profits, making it a straightforward yardstick for a mature, consistently profitable services business like TKC.
TKC screens as expensive against the broader JP Professional Services industry average of 14x, yet it trades below the peer average multiple of 23.2x. This suggests investors assign it a premium to the sector, but not a leadership valuation. With the current P E ratio also marginally above the estimated fair P E of 17.6x, the market is placing TKC just ahead of where our fair value work indicates it might settle over time.
Explore the SWS fair ratio for TKC
Result: Price-to-Earnings of 17.7x (ABOUT RIGHT)
However, slower than expected revenue growth and execution missteps on planned buybacks could challenge the investment case and limit further re rating.
Find out about the key risks to this TKC narrative.
Another View: Discounted Cash Flow Signals Value
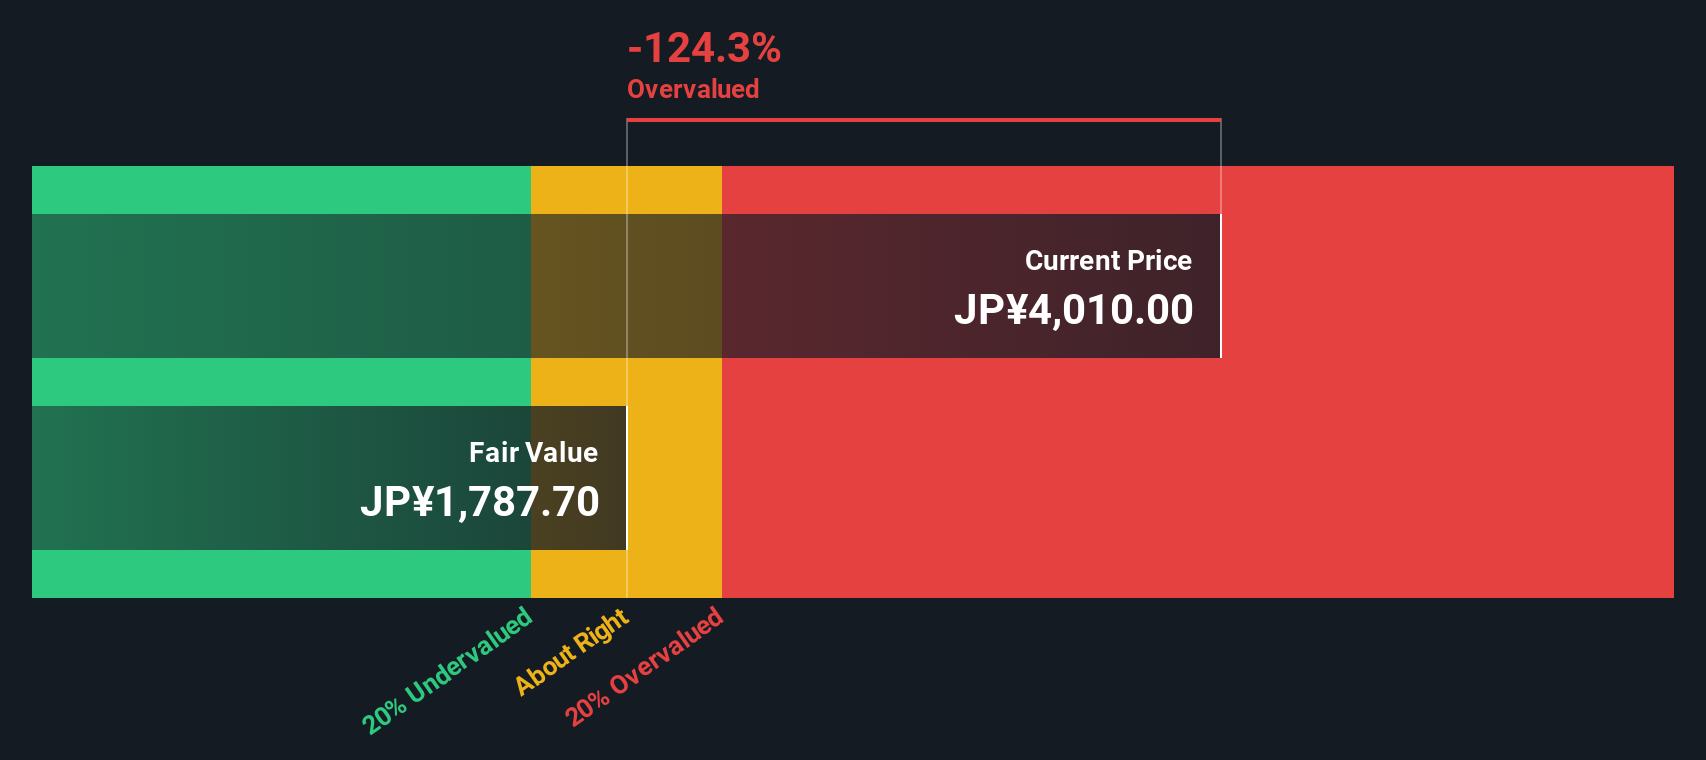
While the current 17.7x earnings multiple looks about right, our DCF model paints a different picture, with TKC trading roughly 14% below its fair value estimate of ¥4,867. That suggests the market may be underpricing its steady cash generation, but it is unclear if sentiment will ever catch up.
Look into how the SWS DCF model arrives at its fair value.
Simply Wall St performs a discounted cash flow (DCF) on every stock in the world every day (check out TKC for example). We show the entire calculation in full. You can track the result in your watchlist or portfolio and be alerted when this changes, or use our stock screener to discover 914 undervalued stocks based on their cash flows. If you save a screener we even alert you when new companies match - so you never miss a potential opportunity.
Build Your Own TKC Narrative
If you see things differently or simply prefer building your own view from the numbers, you can craft a personalized narrative in minutes: Do it your way.
A good starting point is our analysis highlighting 4 key rewards investors are optimistic about regarding TKC.
Looking for more investment ideas?
Before you move on, lock in your next opportunity now using the Simply Wall Street Screener, so you are not relying on TKC alone.
- Capture early-stage potential in companies that still fly under the radar by scanning these 3634 penny stocks with strong financials poised for stronger financial performance.
- Position yourself at the heart of the AI revolution by targeting these 24 AI penny stocks with compelling growth stories and scalable technologies.
- Secure a more reliable income stream by focusing on these 12 dividend stocks with yields > 3% that can help support returns even when markets turn volatile.
This article by Simply Wall St is general in nature. We provide commentary based on historical data and analyst forecasts only using an unbiased methodology and our articles are not intended to be financial advice. It does not constitute a recommendation to buy or sell any stock, and does not take account of your objectives, or your financial situation. We aim to bring you long-term focused analysis driven by fundamental data. Note that our analysis may not factor in the latest price-sensitive company announcements or qualitative material. Simply Wall St has no position in any stocks mentioned.
Have feedback on this article? Concerned about the content? Get in touch with us directly. Alternatively, email editorial-team@simplywallst.com